Quick Links
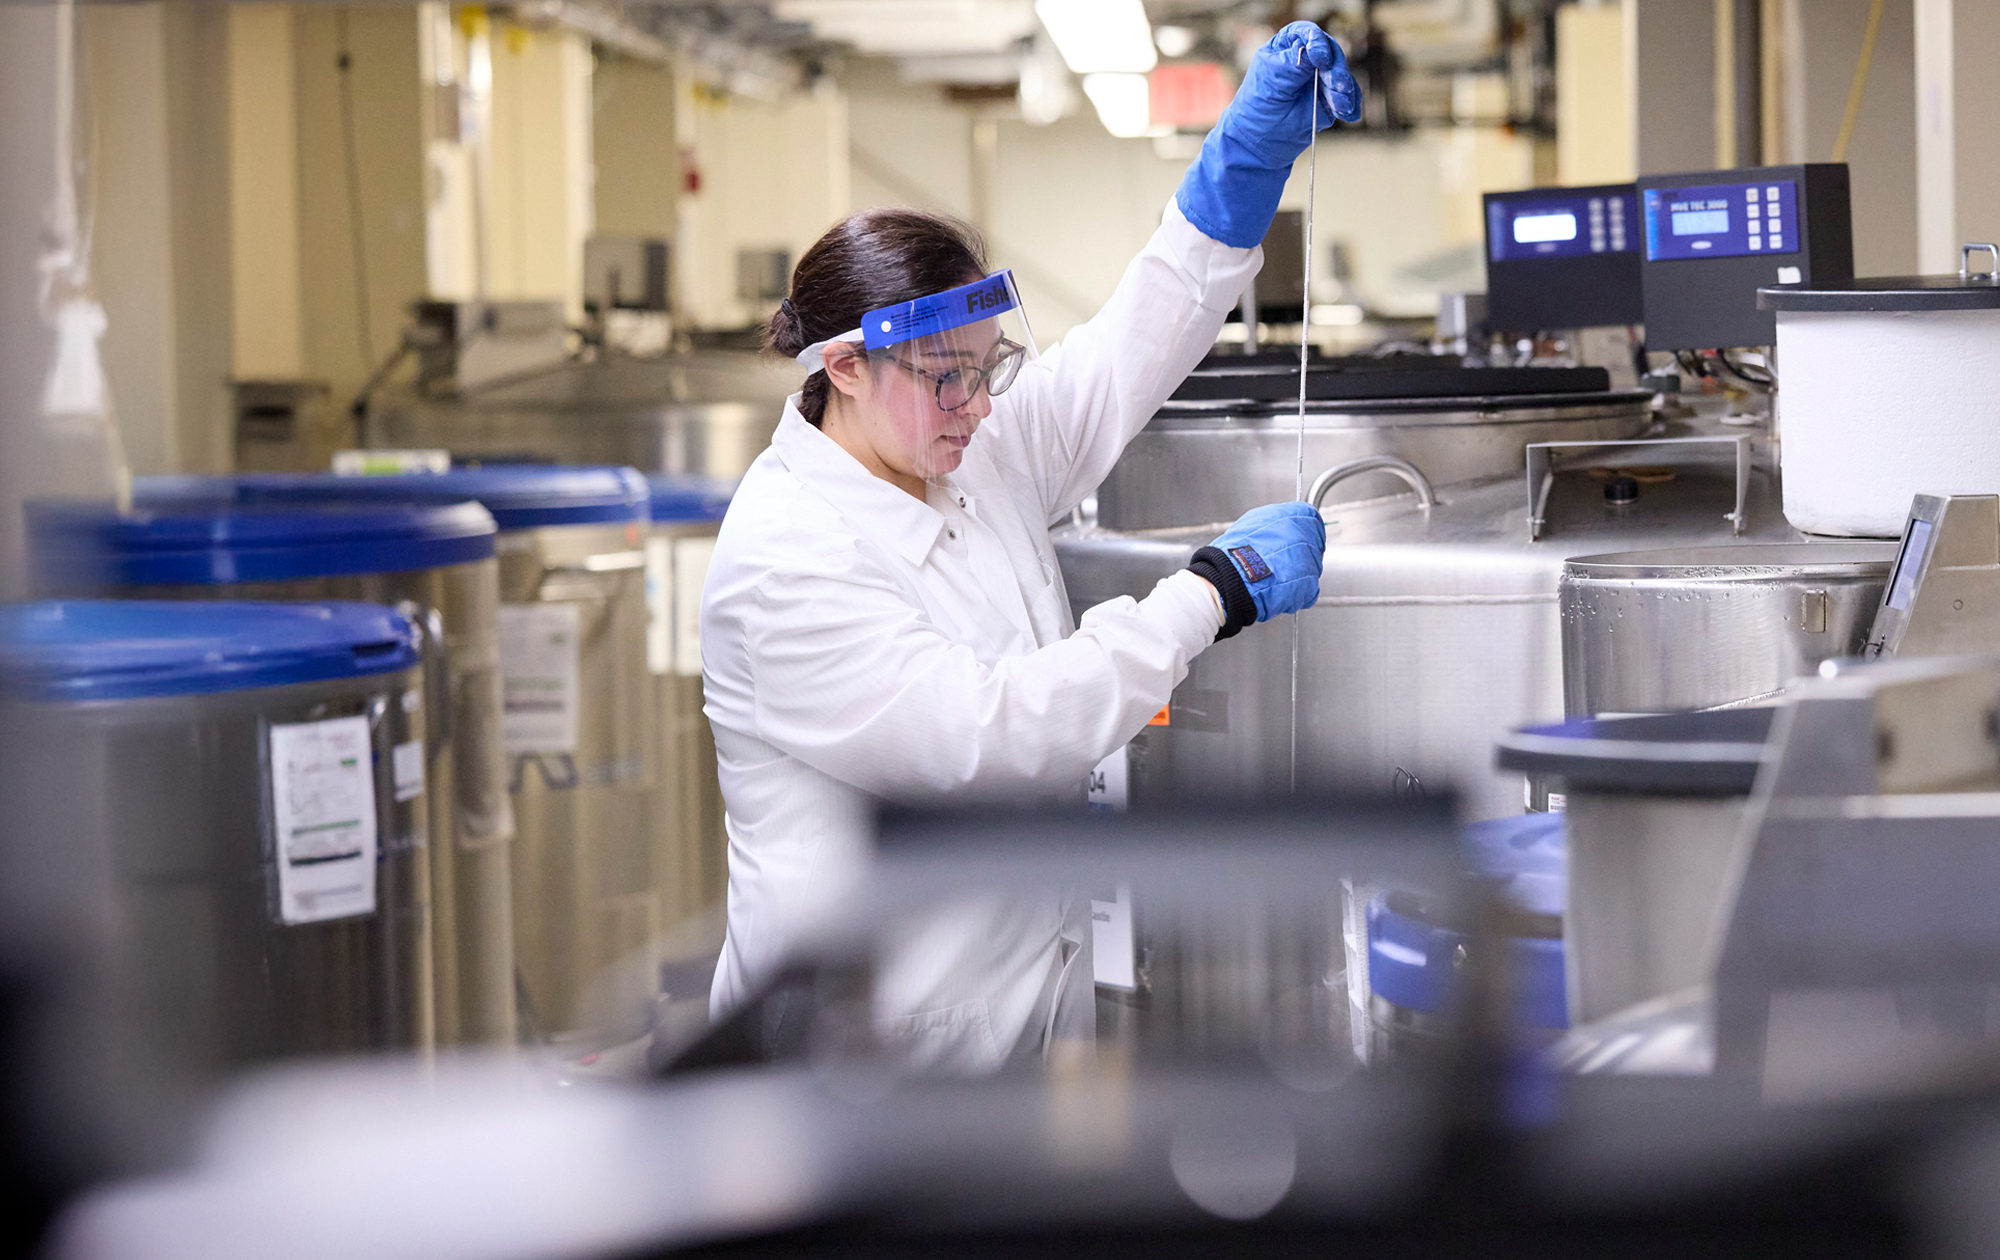
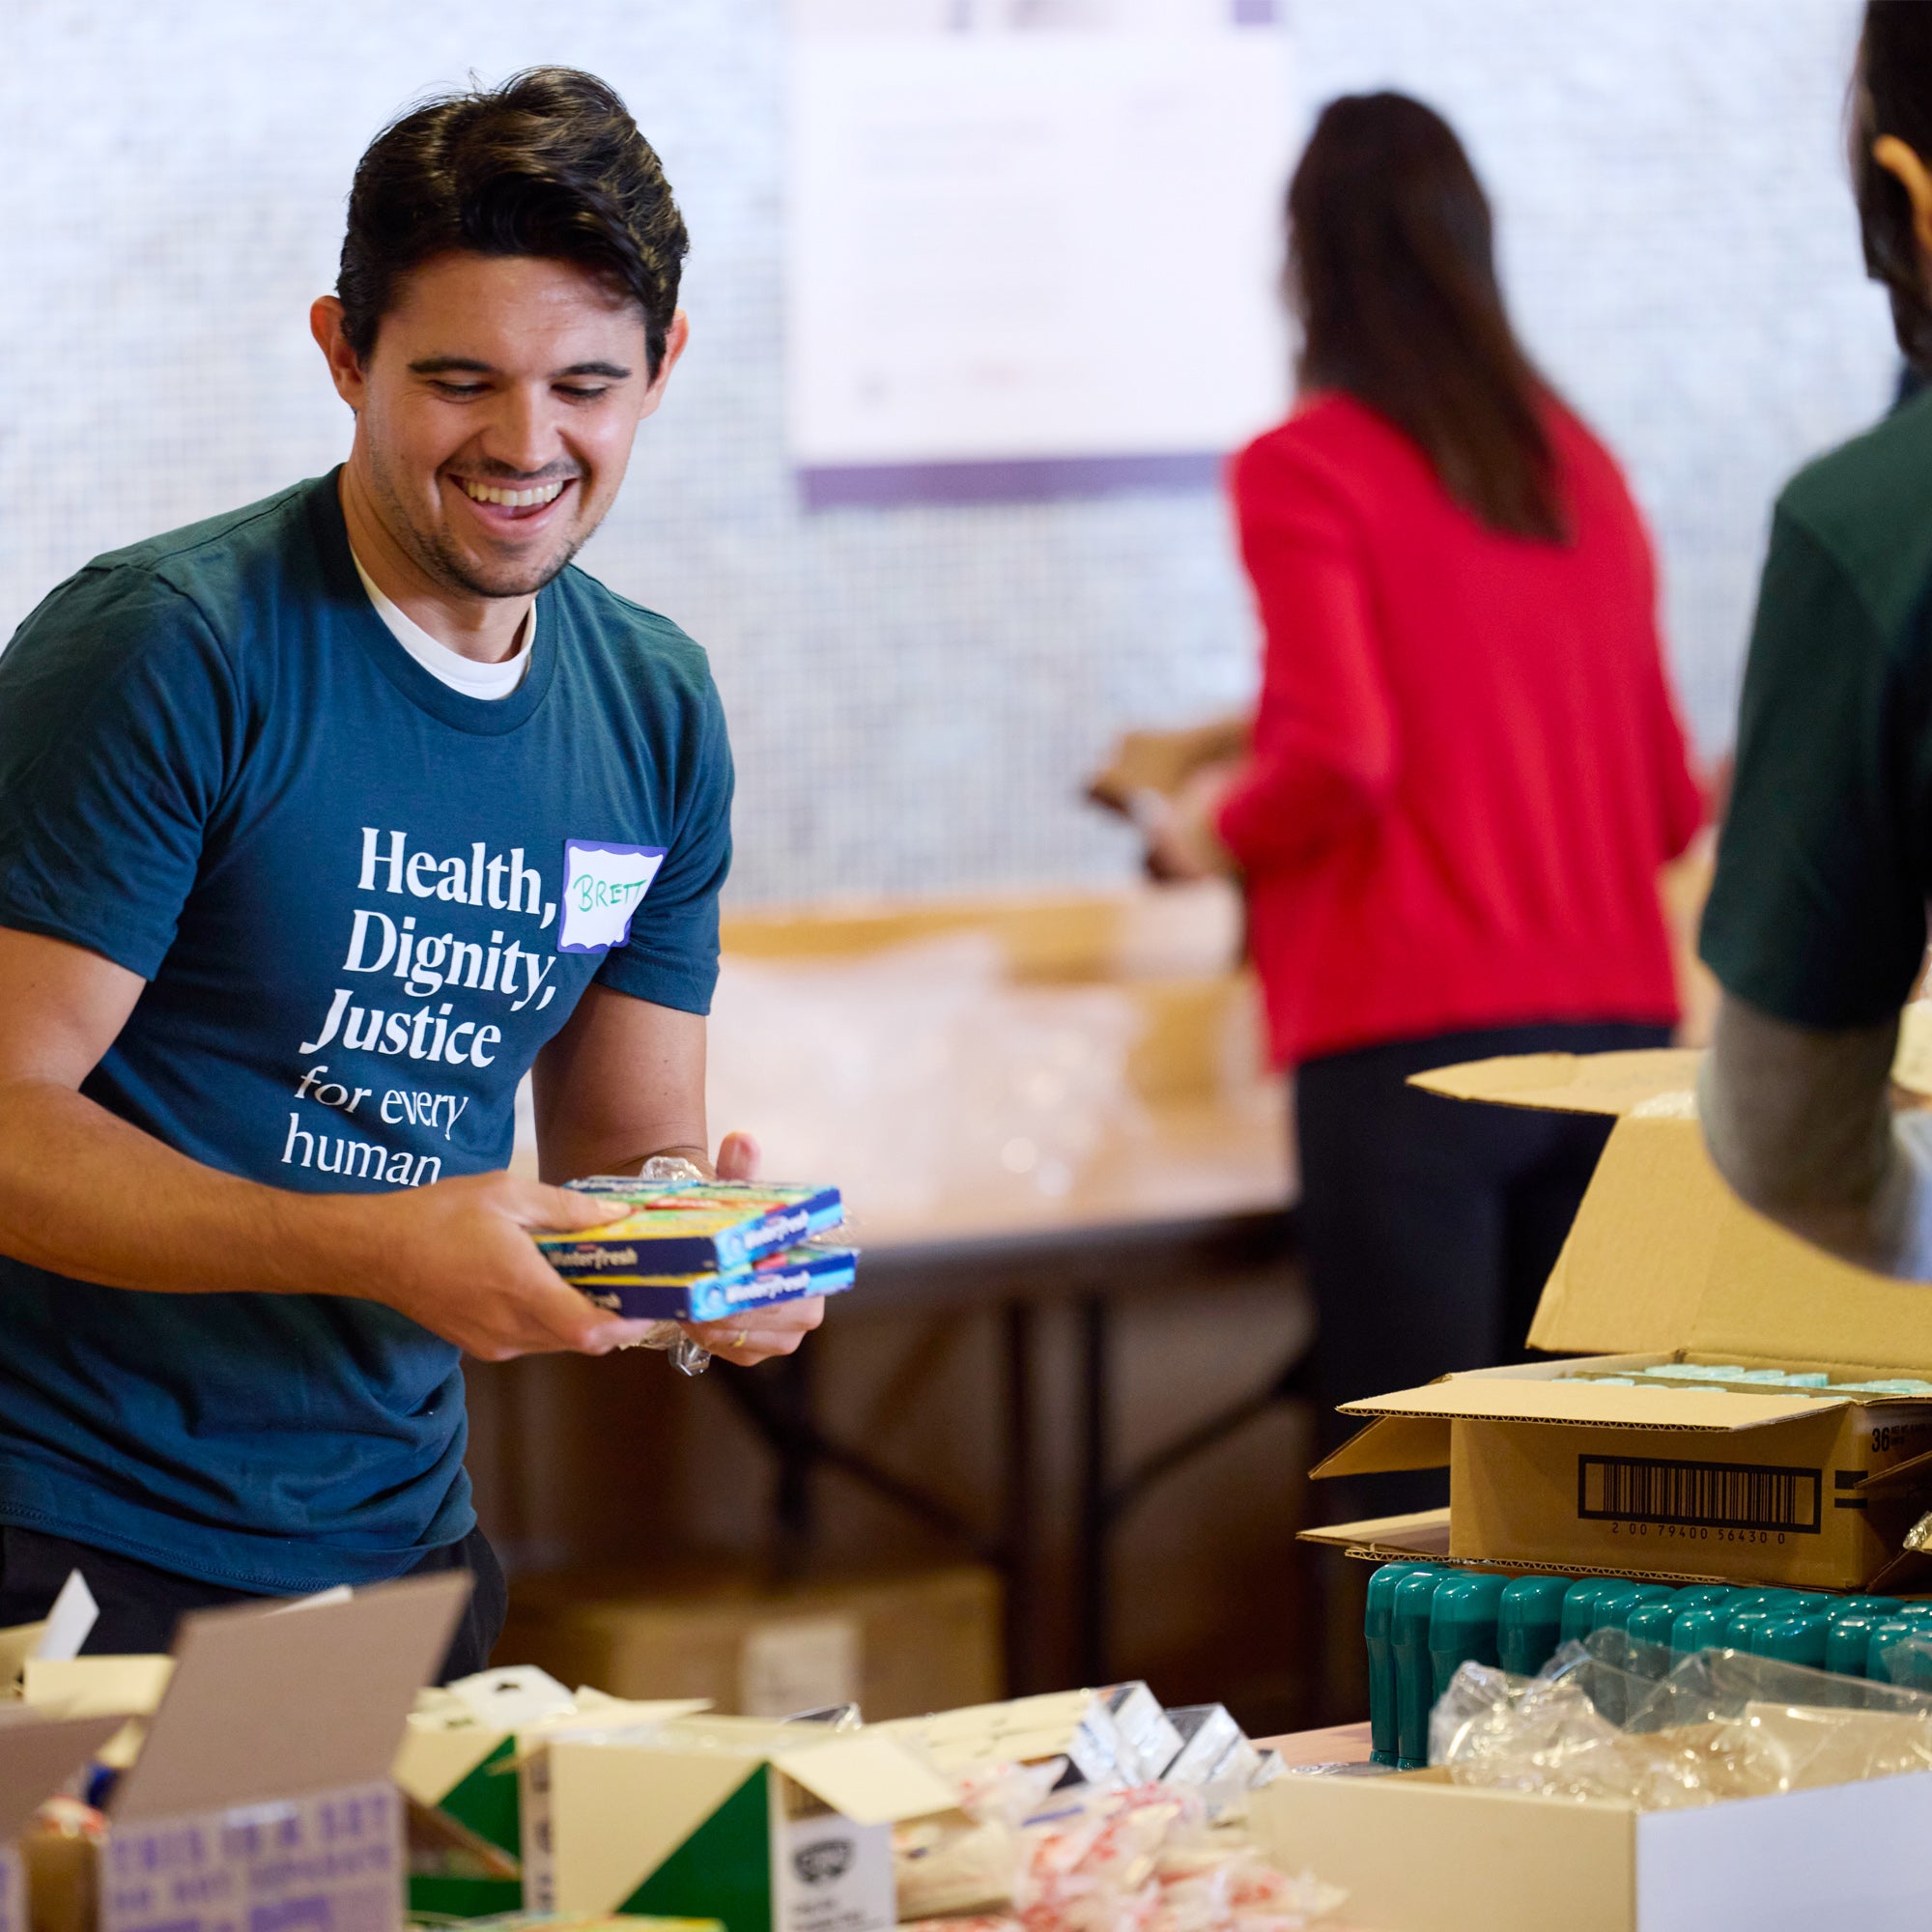
Research with real-world impact
Our faculty and students work together to improve health, prevent disease, and support well-being.
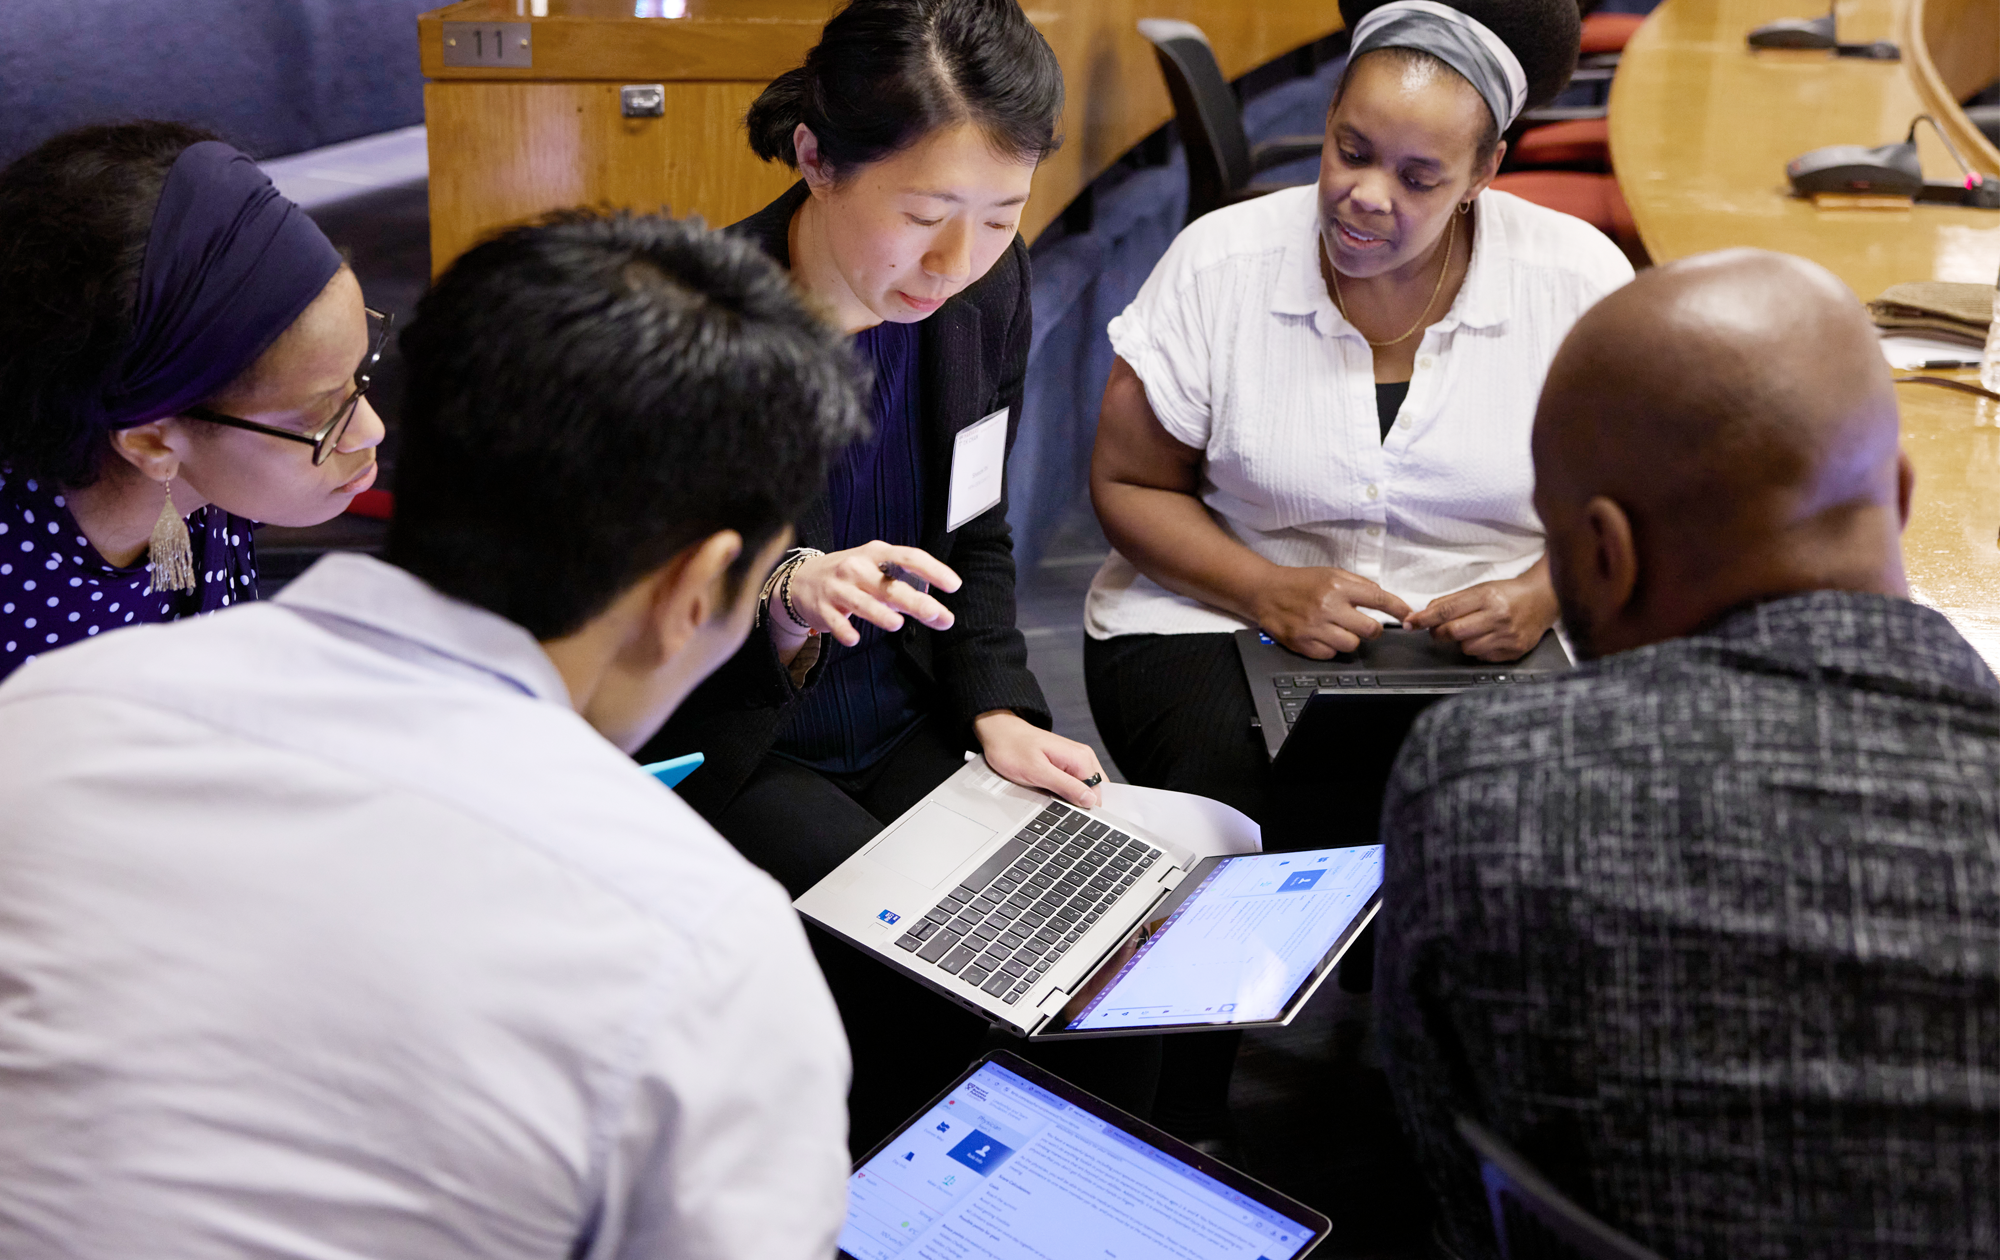
A student experience to match your goals.
Truly global community
Join a powerful network of 16,000+ alumni, including global leaders in health policy, practice, and advocacy at the highest levels.
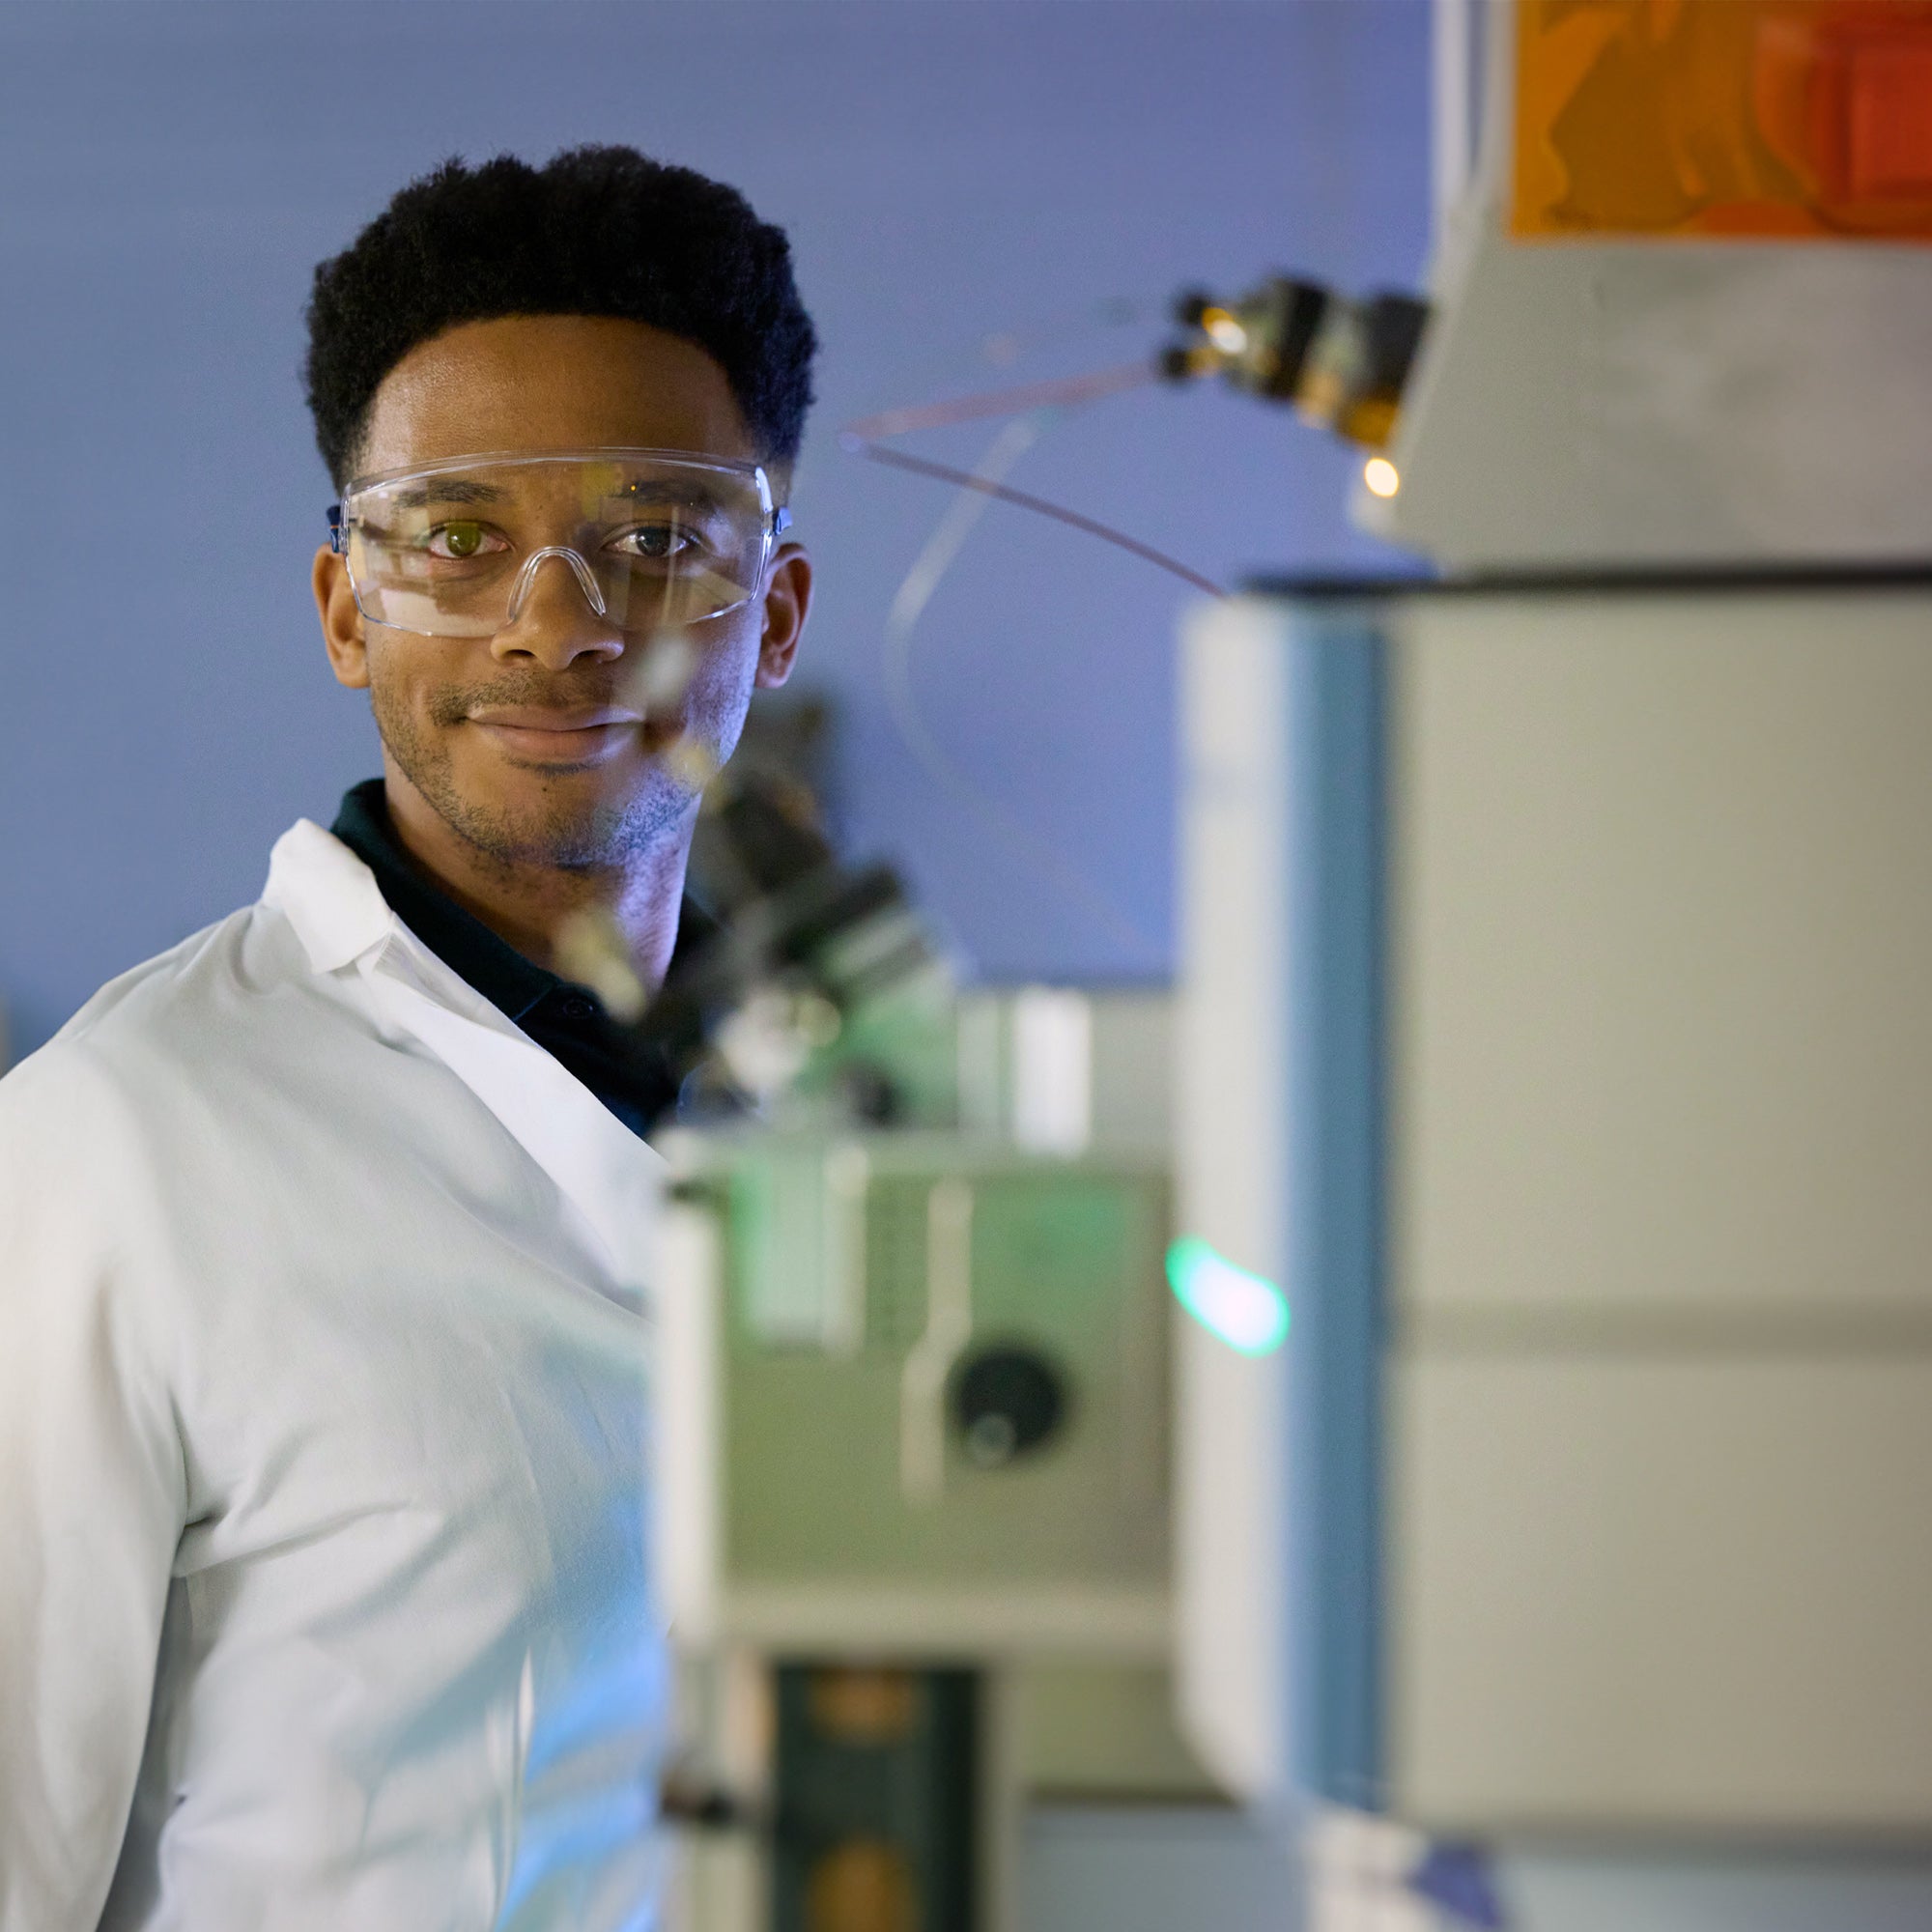
Programs on campus, online, and in the field
Choose from 35 degree programs and over 150 executive education classes to fit your schedule. Apply your learning in the field with hands-on research and practicum opportunities in dozens of countries.
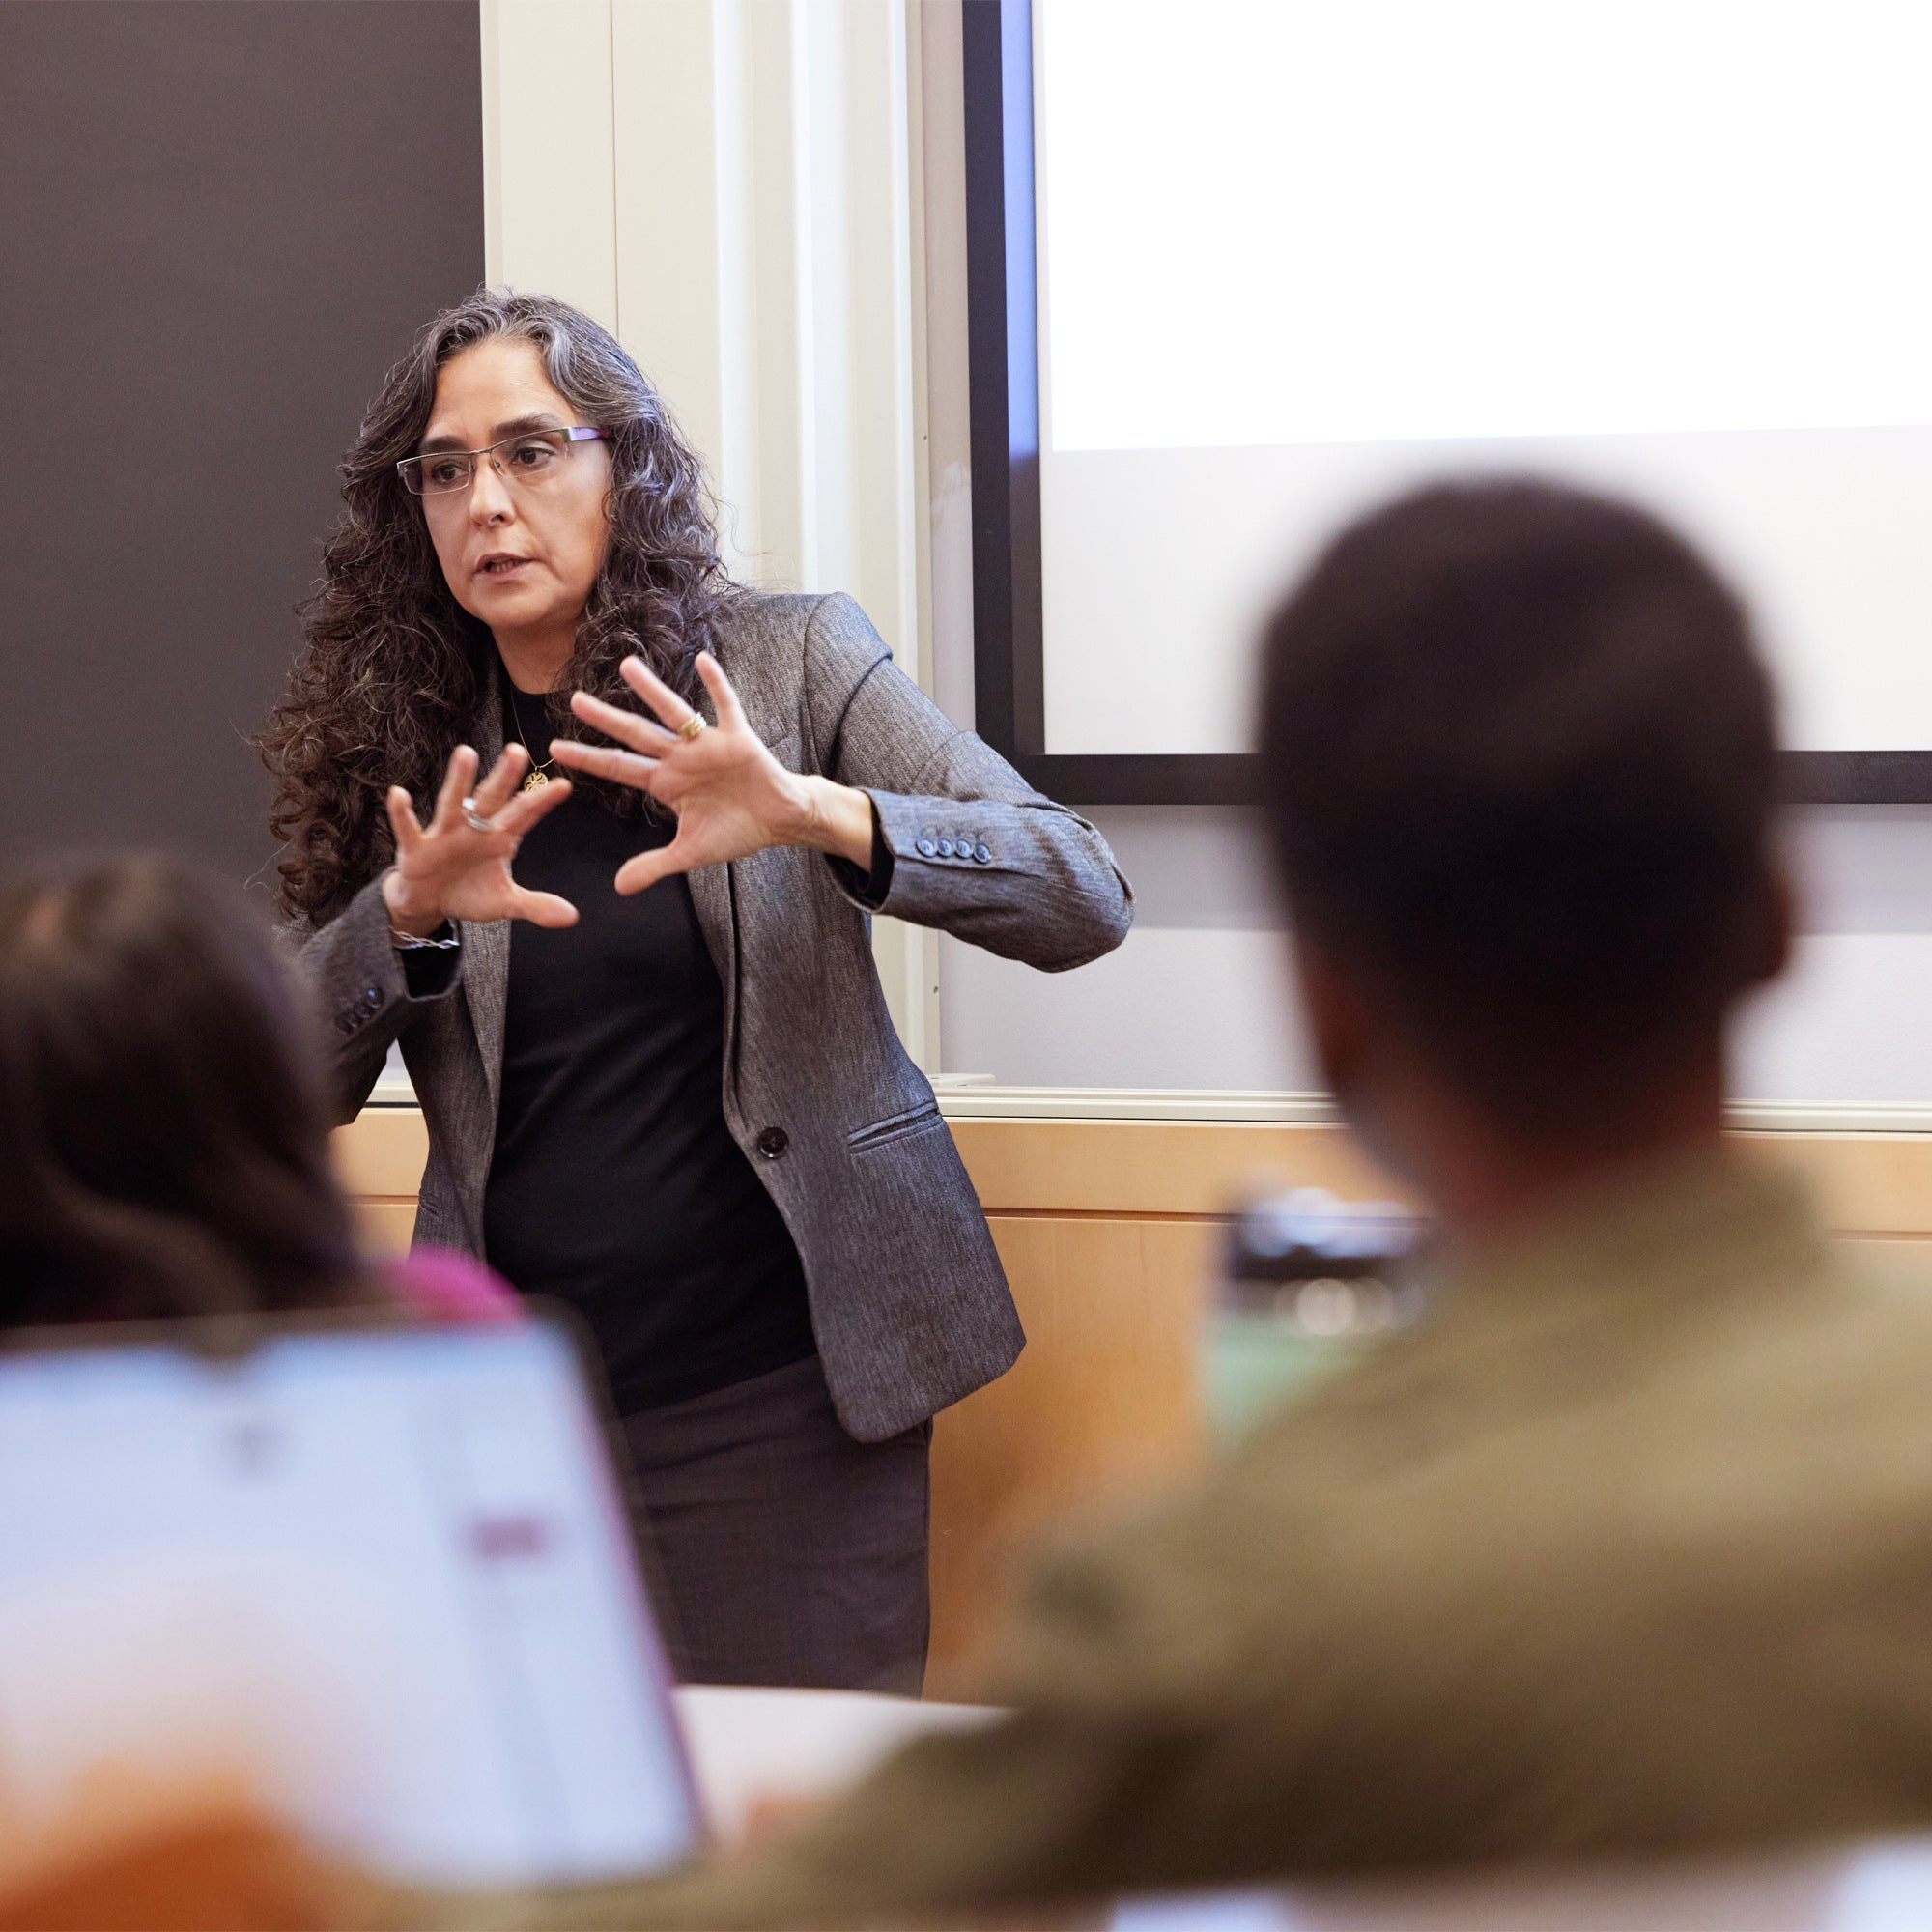
Accessible faculty and dedicated mentors
Learn from world-class scientists and practitioners, including nearly 500 faculty and more than 100 research scientists. Find mentors who will support you, challenge you, and open doors for you in every field of study.