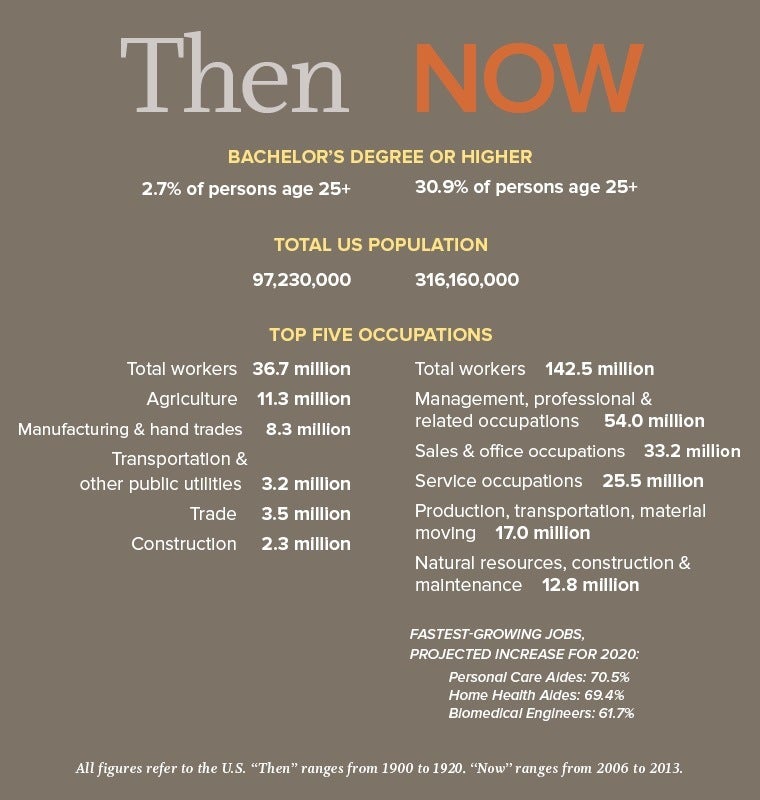
From Infographic: Then and now
Sources:
- Education then and now: Percentage of persons age 25 and over with high school completion or higher and a bachelor’s or higher degree, by race/ethnicity and sex: Selected years, 1910 through 2012. National Center for Education Statistics. U.S. Department of Education. Retrieved from http://nces.ed.gov/programs/digest/d12/tables/dt12_008.asp
- US population then: Historical National Population Estimates: July 1, 1900 to July 1, 1999. Population Estimates Program, Population Division, U.S. Census Bureau. April 11, 2000. Retrieved from http://www.census.gov/population/estimates/nation/popclockest.txt and now: U.S. and World Population Clock. United States Census Bureau. U.S. Department of Commerce. July 2013. Retrieved from http://www.census.gov/popclock
- Occupations then: Series D 47-61—Labor Force—Industrial Distribution of Gainful Workers (NBER): 1820 to 1940. Historical Statistics of the United States, 1789-1945. Bureau of the Census. U.S. Department of Commerce. 1949. Retrieved from: http://www2.census.gov/prod2/statcomp/documents/HistoricalStatisticsoftheUnitedStates1789-1945.pdfand now: Employed persons by occupation, sex, and age: 2011-2012. Labor Force Statistics from the Current Population Survey. Bureau of Labor Statistics. U.S. Department of Labor. Retrieved from http://www.bls.gov/cps/tables.htm#charemp
- Fastest growing occupations now: Table 1.3: Fastest growing occupations, 2010 and projected 2020. Employment Projections. U.S. Bureau of Labor Statistics. Retrieved from: http://data.bls.gov/cgi-bin/print.pl/emp/ep_table_103.htm