Graduate Employment Outcomes
Class of 2020: Post-Graduation Status, Salary, Sample Employers
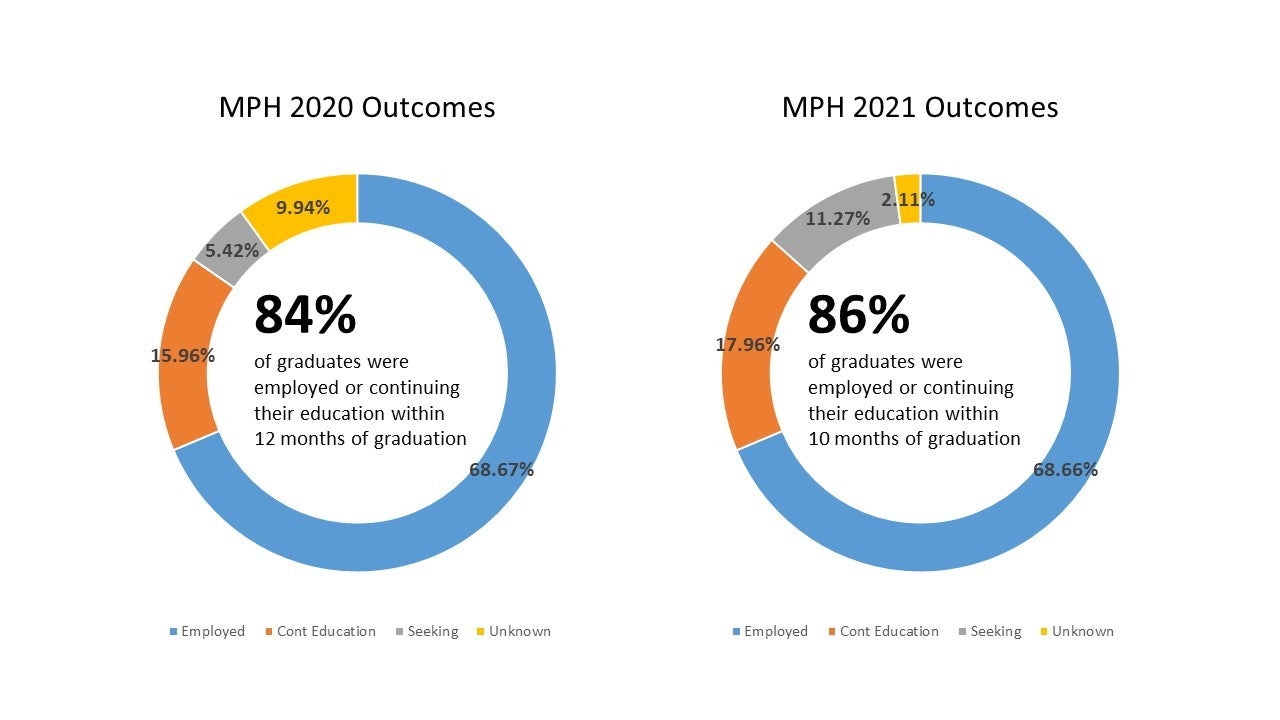
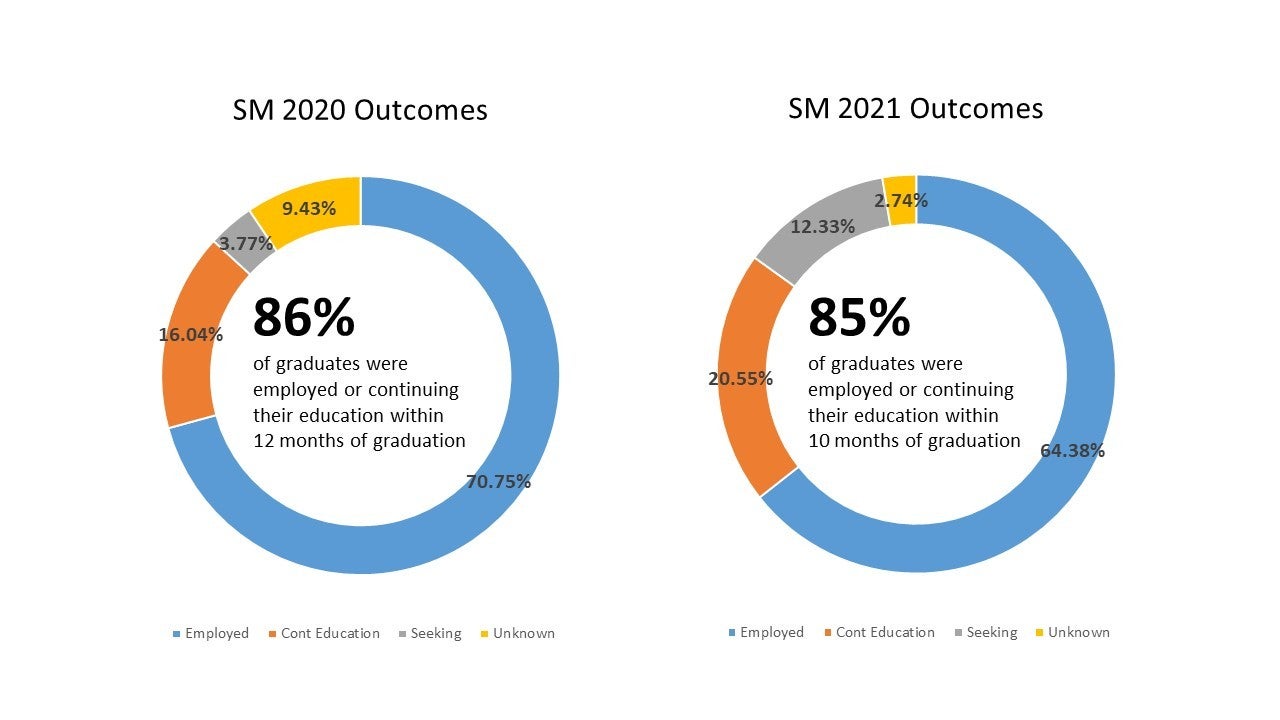
In 2020 86% of graduates were employed or continuing their education within 12 months of graduation. In 2021 85% of graduates were employed or continuing their education within 10 months of graduation. This data only includes responses received on the post-graduate outcomes survey.
The information presented in the report below is a summary of the post-graduation outcomes for survey respondents six months after graduation. The report below includes the Class of:
- 2017 (November 2016, March 2017 and May 2017)
- 2018 (November 2017, March 2018, and May 2018)
- 2019 (November 2018, March 2019, and May 2019)
When reviewing this information, keep in mind:
- Several of our programs, most notably our MPH program, have changed over the past few years and the current composition of students is slightly different than the students surveyed in the previous Classes.
- The MPH-65 program began in September 2016 (replacing a two year master degree) and these graduates are not included in the Class of 2017 data. The first cohort of graduates is the Class of 2018.
- Prior education, training and interests play a significant role in the types of positions our recent graduates seek and obtain. Many of our students come to Harvard Chan with prior professional degrees, including medical degrees, and many have prior professional experience, some more extensive than others. Some students want to use their Harvard Chan education to expand their current roles and others want to completely change the direction of their career.
- Some of the survey respondents did not include all of the information requested in the survey, for example, they may have indicated they are employed but did not include information about their employer and therefore some of the employer information is incomplete.
Post-Graduation Plans Based on Degree Program and Field of Study/Department
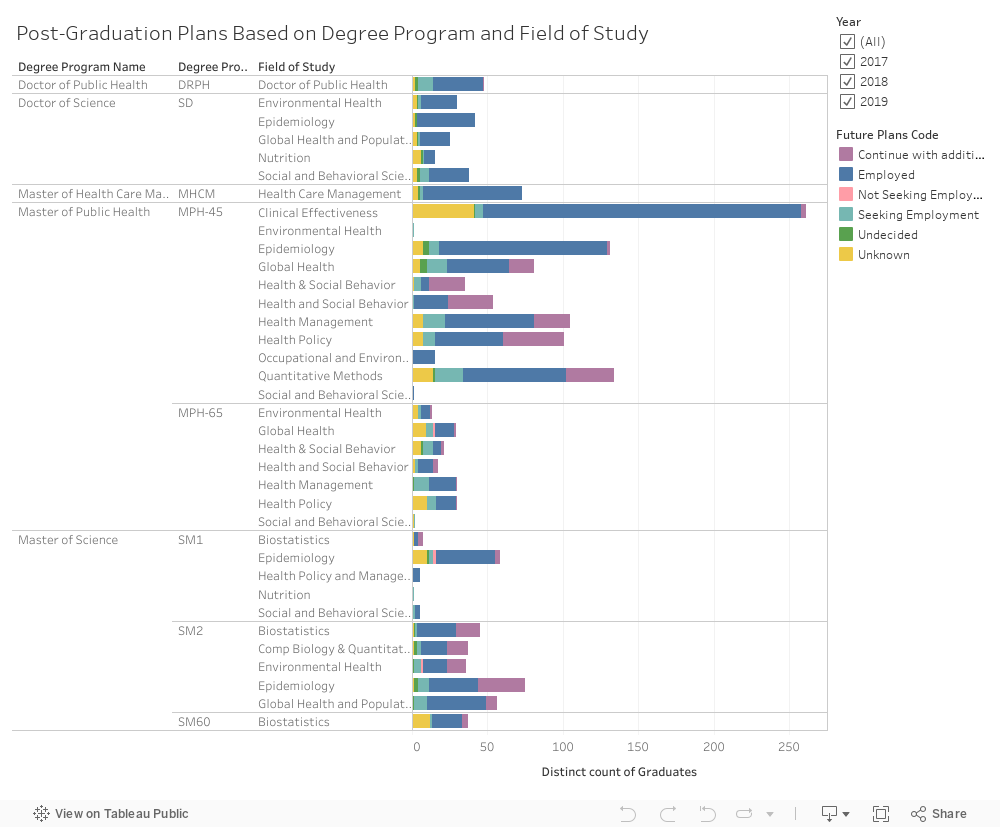
Note:
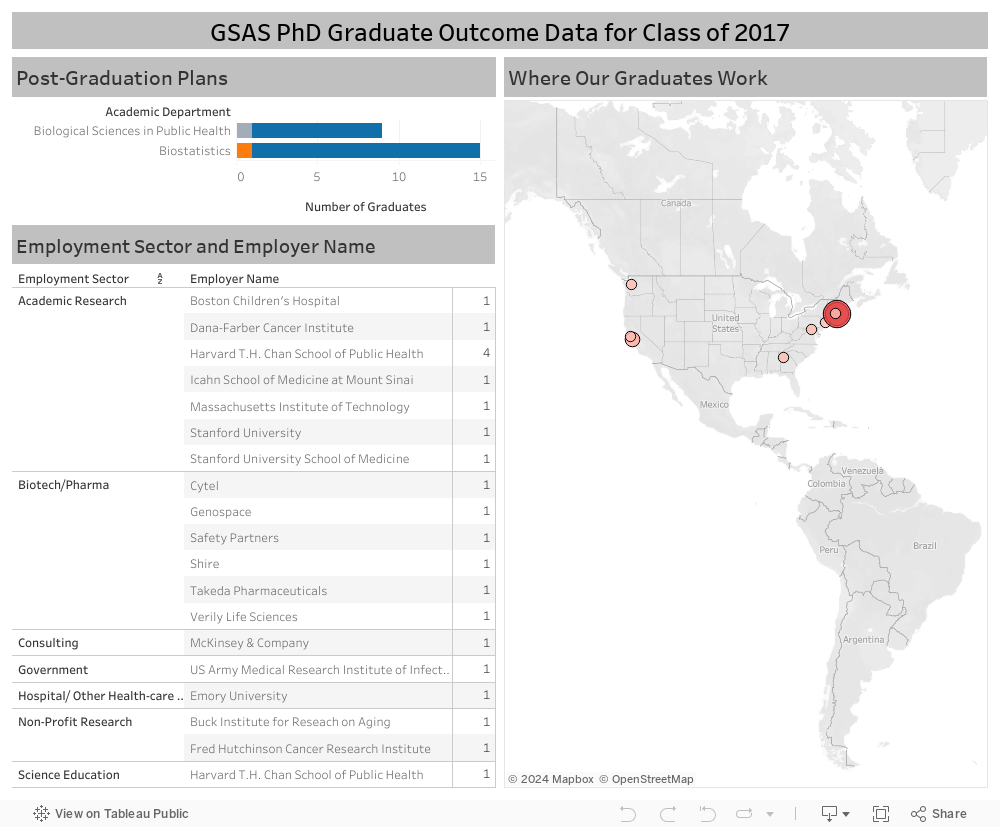
1. This dashboard does not include PHD students. The data for PHD Students runs through GSAS and is displayed on the dashboard at the end.
Graduate Outcome Data for Class of 2017 and 2018
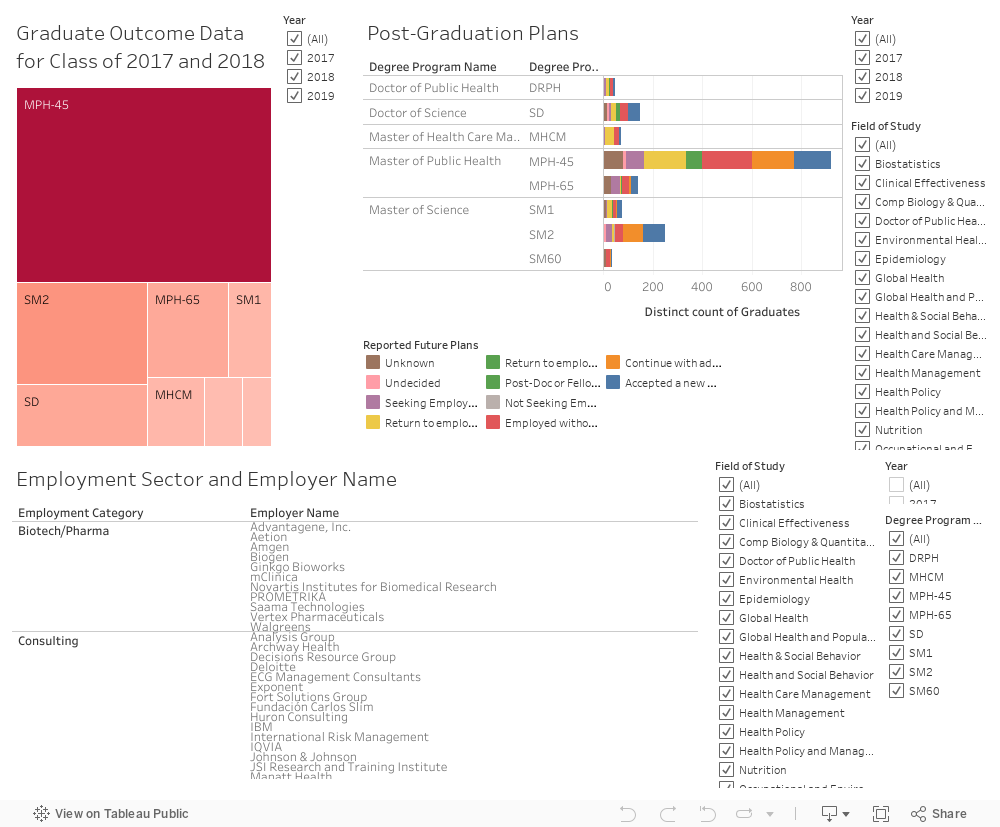
Note:
1. This dashboard does not include PHD students. The data for PHD Students runs through GSAS and is displayed on the dashboard at the end.
Education Prior to Attending Harvard Chan
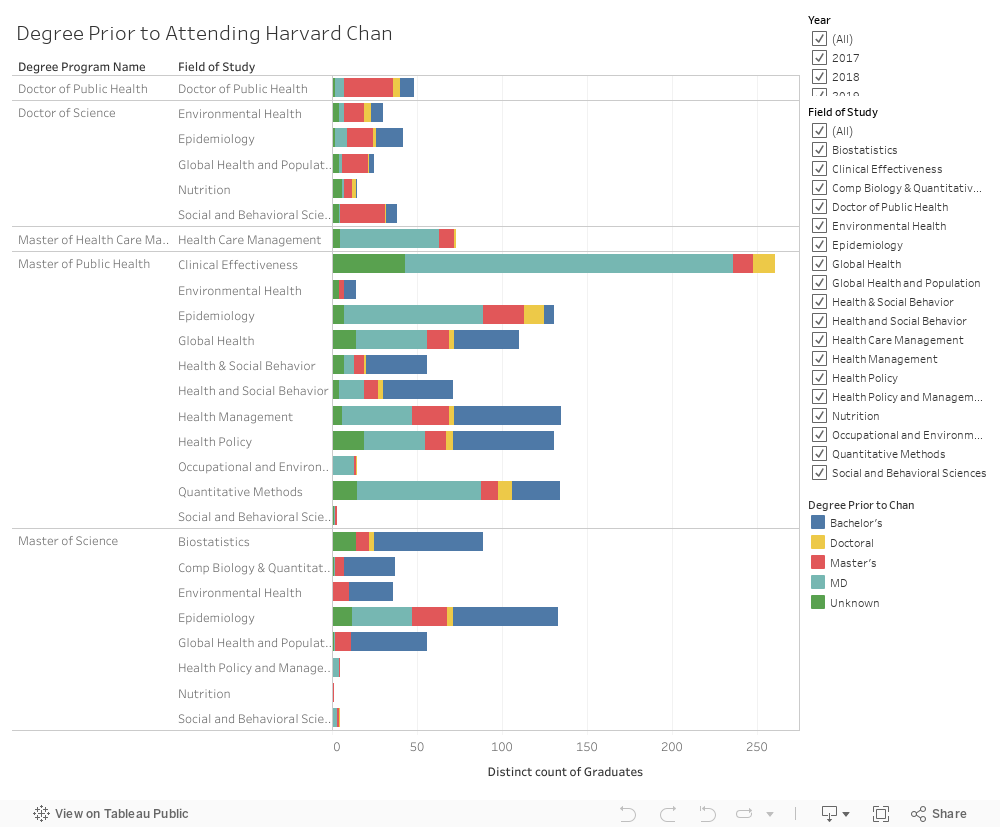
Note:
1. This dashboard does not include PHD students. The data for PHD Students runs through GSAS and is displayed on the dashboard at the end.
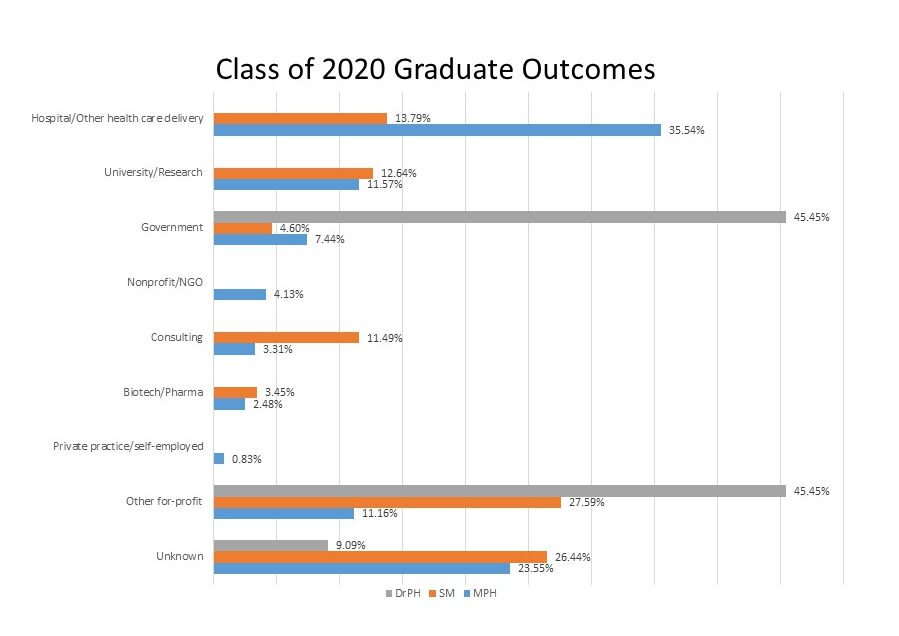
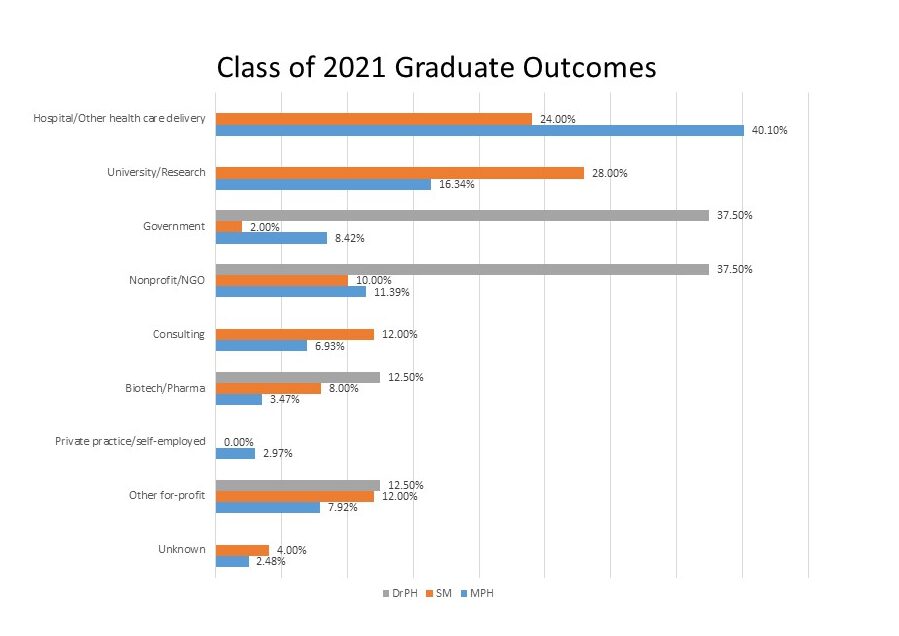
Post-Graduation Employment by Employment Sector, and Company
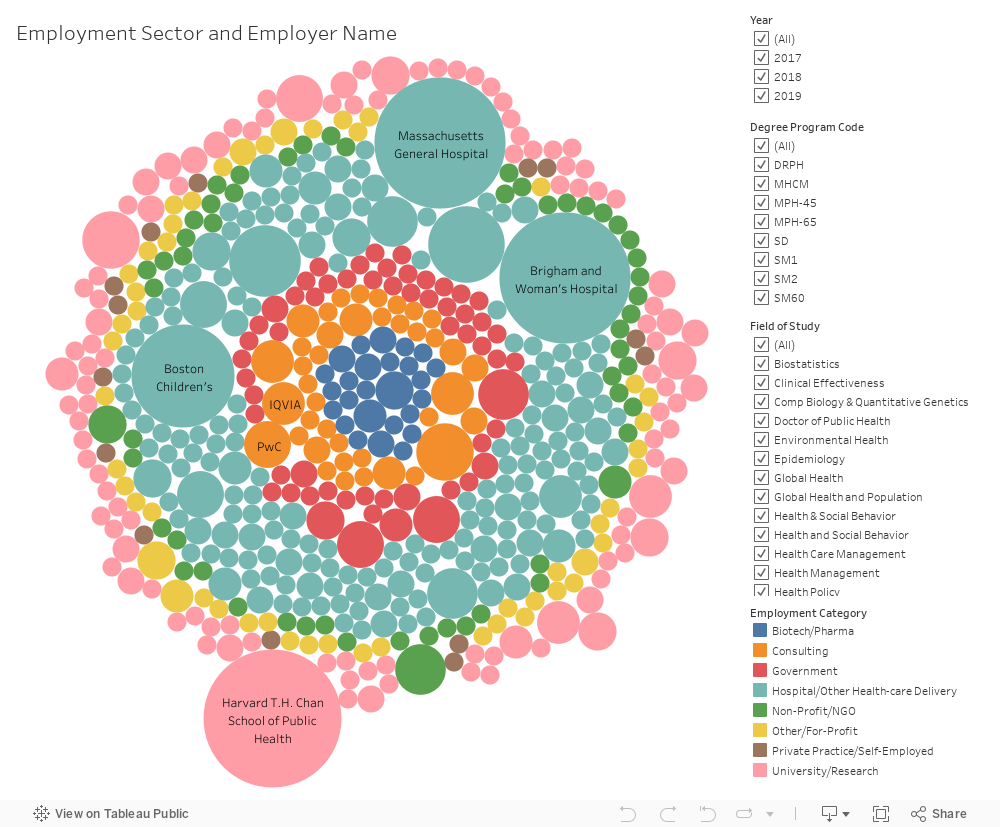
Note:
1. This dashboard does not include PHD students. The data for PHD Students runs through GSAS and is displayed on the dashboard at the end.
2. Most Clinical Effectiveness students work in the “Hospital/Other Health-care Delivery Employment Category, which may skew the data. To remove this subset, unselect “Clinical Effectiveness” from the legend on the right under “Field of Study.”
Class of 2016 Graduate Employment Outcome Data