The CoBE team – with researchers from Harvard Healthy Buildings program, Oregon State University College of Engineering, and Boston University School of Public Health – reports on a novel method for calculating health and climate impacts of building energy savings. Here are three key takeaways from our study.
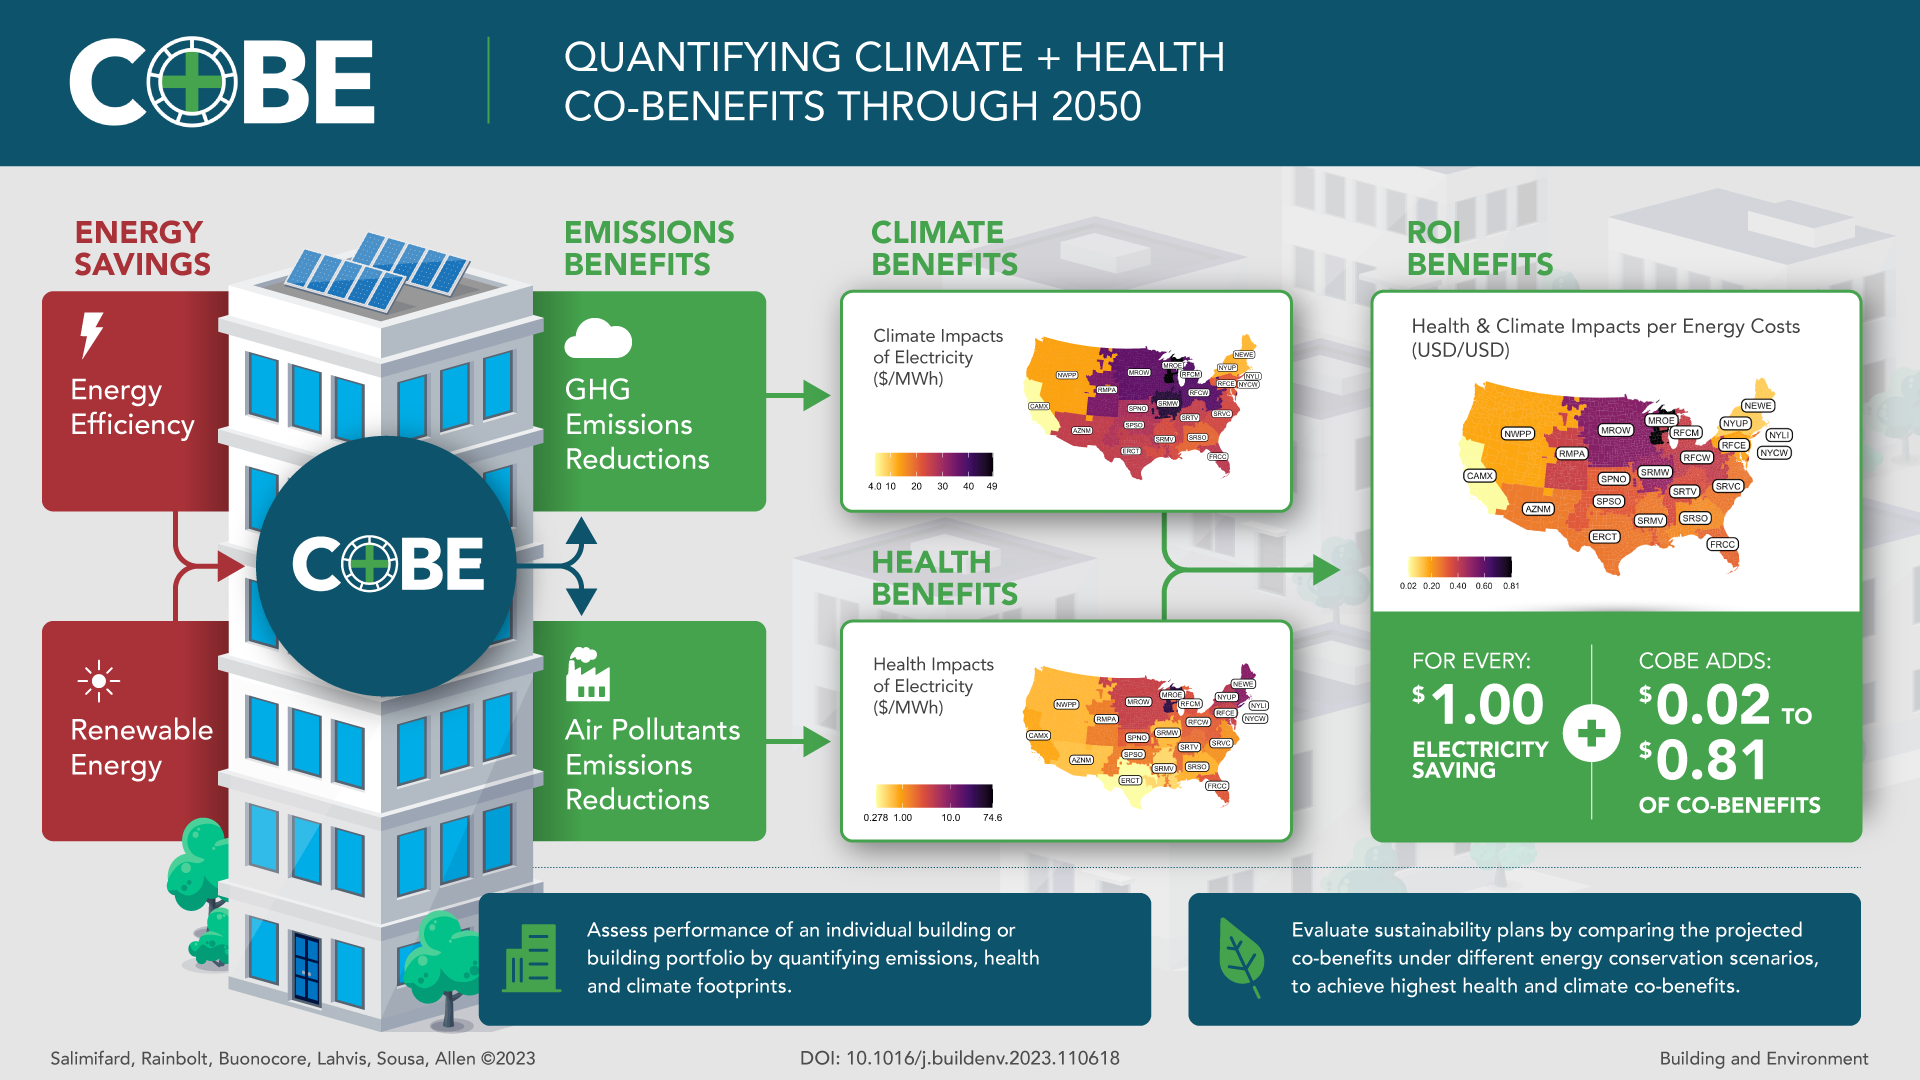
Figure 1. CoBE Projection can aid stakeholders and decision-makers in (1) assessing current individual building or building portfolio performance by quantifying emissions, health, and climate footprint; and (2) evaluating their sustainability plans by comparing the projected co-benefits under different energy conservation scenarios, to achieve highest health and climate co-benefits.
- CoBE is a novel and valuable tool for assessing the health and climate co-benefits of changes in building energy use.
Buildings consume 40% of energy in the U.S., so changes in building energy use can significantly decrease air pollution and greenhouse gas emissions, leading to health and climate benefits. This means that buildings can have a major role in decarbonization. The CoBE team – with researchers from Harvard Healthy Buildings program, Oregon State University, and Boston University – developed the Co-benefits of the Built Environment (CoBE) Projection tool, which quantifies the health and climate impacts of building energy use. CoBE uses information about a building’s location, energy sources, and energy consumption to estimate its greenhouse gas and air pollutant emissions. Then, using standard tools from climate economics and public health – the social cost of carbon and air pollution models which incorporate the value of a statistical life – CoBE generates estimates of the health and climate costs specific to the location of the buildings. By comparing different scenarios, users of the tool can estimate the health and climate co-benefits of making changes to the energy use of one or many buildings.
The novelty of CoBE Projection is that it can:
- Assess both climate and health impacts of energy use and put them in monetary terms, while incorporating energy and location data
- Calculate impacts of all building energy consumption, including both electricity and fuel use on-site, and allow users to determine which types of energy consumption are driving their impacts
- Quantify footprints of individual buildings and evaluate changes in those buildings, as opposed to only evaluating changes across the entire building stock
2. CoBE can project the co-benefits of building energy use out to 2050.
CoBE can project the health and climate impacts of building energy use scenarios to 2050, using energy projections from the U.S. Energy Information Administration. These scenarios account for factors including but not limited to the construction and retirement of power plants, changes in prices of natural gas and oil, and transmission losses for electricity. With the new projection feature, users can study how changes in building energy use will interact with changes in the electrical grid to affect the air pollution and greenhouse gas emissions associated with specific buildings. This is important because changes to the electrical grid will alter the impacts of building energy use at baseline, and affect the emissions and impacts under different scenarios.
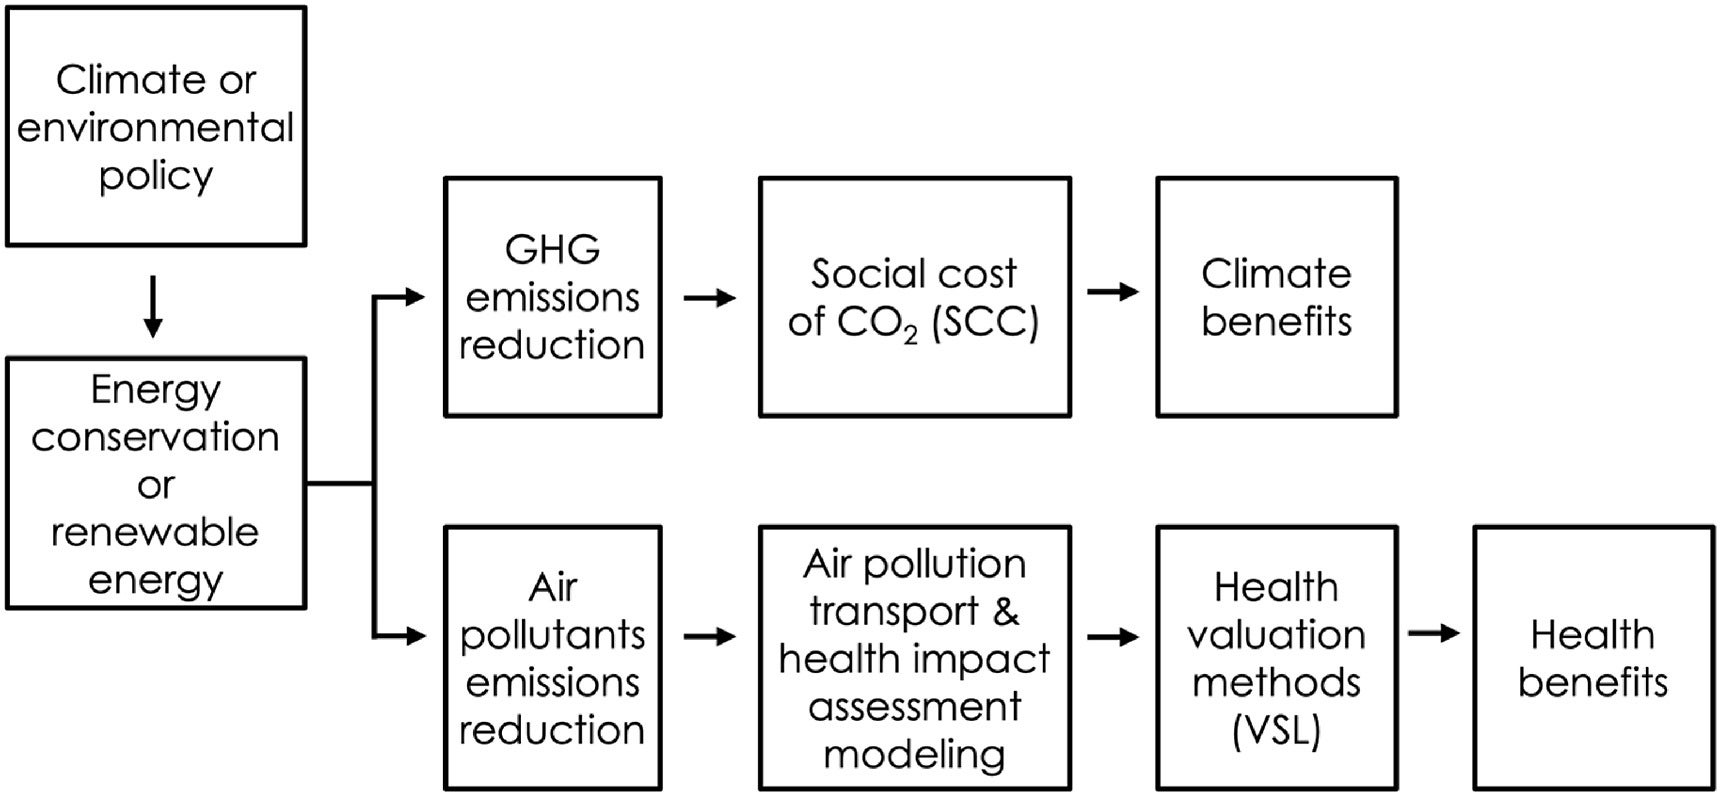
Figure 2. How CoBE estimates the co-benefits of a policy or initiative which affects building energy use.
- Geographic location plays an important role in driving health and climate impacts of building energy use within the U.S., and both health and climate impacts must be recognized
We used CoBE to model the effect of a hypothetical reduction in building electricity use across the U.S. from 2018 to 2050, assuming that each U.S. building reduces its electricity use by 1 MWh annually.
We found that although the change in electricity use is constant across all buildings in the modeled scenario, a building’s geographic location plays an important role in determining its health and climate impacts, since location determines the carbon intensity and health impacts of energy consumption. Overall, in the year 2050, depending on the region and air pollution model used, climate and health co-benefits add $0.02-$0.81 of additional savings for each dollar of electricity savings, but there is substantial variation by region. For example, for every dollar of electricity savings in 2018, one region in Wisconsin and Michigan experiences an additional $0.52-$0.70 in health and climate co-benefits (range indicates values produced by different models). In contrast, another region which encompasses most of the state of California experiences only $0.05-$0.06 of health and climate savings for every dollar of electricity savings in 2018. These differences are largely driven by differences in the regional electrical grids.
Crucially, there is very little overlap between the regions where reducing electricity consumption resulted in high climate benefits vs those where there were high health benefits. Of the 26 regions studied, only one of the five regions with the greatest climate impact was in the list of the top five regions with the greatest health impact. This indicates that the factors that drive climate impacts are different from those driving health impacts. Climate impacts are largely driven by total GHG emissions, health impacts are largely driven by emissions of air pollutants occurring in places where large populations are exposed, and these two factors do not often coincide. This makes it even more important to incorporate both health and climate in energy decision making, since actions that have high benefits for climate may not have large benefits for health, and vice versa. This means that energy-related decisions that are exclusively focused on climate impacts risk leaving behind major opportunities for health benefits. Similarly, energy related decisions that are made exclusively on the basis of air quality and health will leave behind benefits for climate. The CoBE tool will allow users, including investors, building owners and operators, policymakers, utility operators, and governments to evaluate and design strategies while incorporating both climate and health benefits from energy choices.
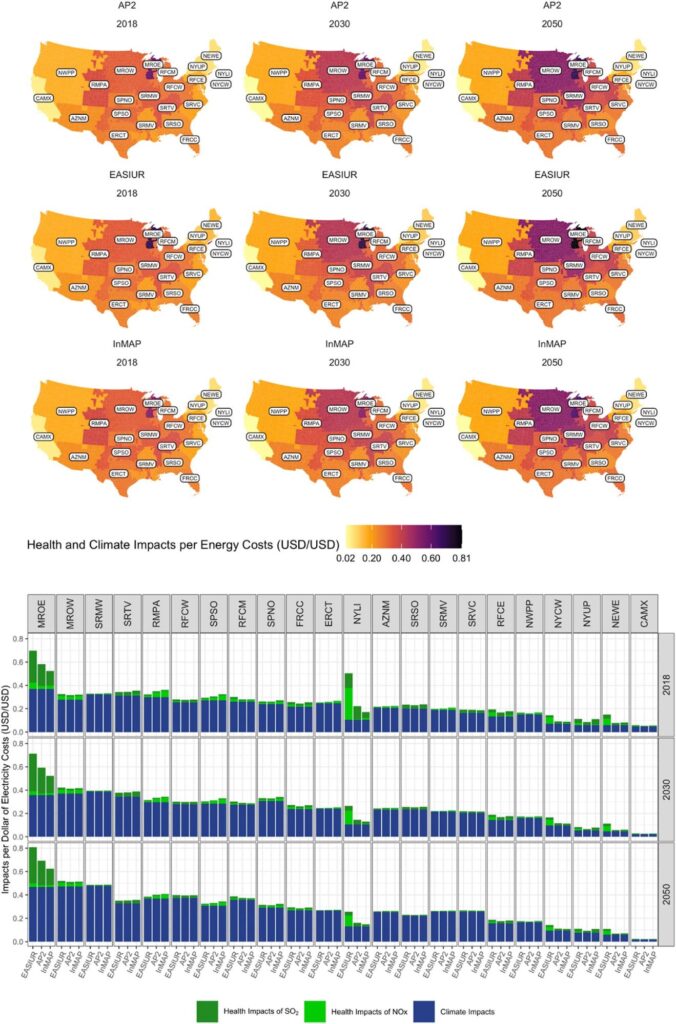
Figure 3. Combined health and climate savings per dollar of electricity savings in 26 grid regions of the contiguous US, under three different air pollution models (AP2, EASIUR, and InMAP) across three different years (2018, 2030, and 2050).
To learn more about the CoBE, you can watch these videos:
Explore our case studies to learn how the CoBE tool can be applied to measure your building performance and benchmark emissions against climate policies.
Salimifard, P., Rainbolt, M.V., Buonocore, J.J., Lahvis, M., Sousa, B., and Allen, J.G., 2023. A novel method for calculating the projected health and climate co-benefits of energy savings through 2050. Building and Environment, p.110618.
DOI: https://doi.org/10.1016/j.buildenv.2023.110618


