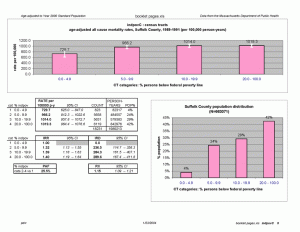
A visual display of the data can offer a dramatic and succinct representation of the socioeconomic disparities in your data. Often, graphical representations provide a means of communicating key features of the data, and can enhance summary presentations of data in tabular form. For example, as part of our project, we produced a series of booklets – one for each health outcome, at each level of geography. Each page of the booklet summarized the standardized incidence rates, rate ratio, rate differences, relative index of inequality, and population attributable fraction, for each ABSM, and was supplemented by a visual display of the incidence rates in each category of the ABSM, and the population distribution of the ABSM. Figure 1 below shows a sample booklet page summarizing the analysis of all cause mortality in Suffolk County, Massachusetts, by CT poverty. (This is the same analysis presented in our case example). Similar pages could be constructed to summarize all cause mortality by % working class, % less than high school education, etc.

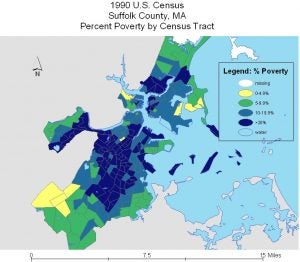
Maps of Census derived ABSMs can also give a dramatic visual representation of how socioeconomic conditions are distributed geographically. In the figure below, we mapped CT level poverty in Suffolk County, MA, using ArcView/ArcGIS.

Mapping of disease rates at the census tract level can present complications, however, because rates for small areas are often unstable due to small numbers. For this reason, and because our focus was on area-based socioeconomic disparities in health across all of Massachusetts and Rhode Island, rather than within specific census tracts, we explicitly chose not to map disease rates as part of this project.
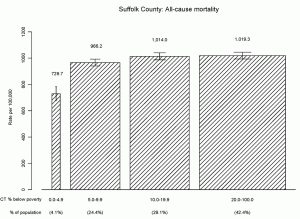
Another way of displaying the data is shown in Figure 2 from the Introduction. In these graphs, which we newly apply to routinely collected U.S. state health department data1-3, the width of each bar is proportional to the size of the population in the specified socioeconomic statum4. We created these graphs in S-plus. Here’s an example of this mode of graphing applied to our case example.

REFERENCES
4. Wagstaff A, Paci P, van Doorslaer E. On the measurement of inequalities in health. Soc Sci Med 1991;33:545-57.


You must be logged in to post a comment.