October 4, 2023 — When people are asked for their height and weight, they often report being a little taller and a little thinner than they actually are. At the population level, this can lead to inaccurate body mass index (BMI) calculations and underestimations of obesity prevalence—a potential problem for researchers and policymakers planning prevention and treatment interventions for this chronic disease.
A novel statistical method developed by Zachary Ward, assistant professor of health decision science at Harvard T.H. Chan School of Public Health, and colleagues gets around biases in self-reporting by combining data from two nationally representative surveys: the Behavioral Risk Factor Surveillance System (BRFSS), and the National Health and Nutrition Examination Survey (NHANES).
BRFSS is a state-based annual telephone survey that collects self-reported height and weight data from more than 400,000 adults. Its data inform the annual obesity prevalence maps created by the Centers for Disease Control and Prevention (CDC). NHANES is not designed to provide state-specific estimates of obesity prevalence and it uses a much smaller sample size—approximately 5,000 people each year—but its BMI data is considered more valid because participants’ height and weight are measured during examinations.
By mapping BRFSS data onto NHANES BMI distributions for a 2019 study, Ward and colleagues were able to generate more accurate state-level estimates of obesity prevalence. The method uses differential bias correction depending on where participants are in the distribution, meaning that those with a higher BMI receive more bias correction than those with a lower BMI.
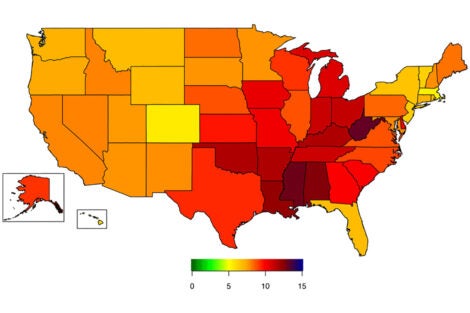
For a study published this summer in the CDC’s journal Preventing Chronic Disease, the researchers worked with CDC colleagues to bias-correct prevalence of severe obesity (BMI ≥40) in the 2020 BRFSS. They found that severe obesity had been significantly underestimated: 8.8% of adults had severe obesity based on the bias-corrected estimates, compared to 5.3% in self reports. Bias-corrected changes in state-level prevalence ranged from 5.5% (Massachusetts) to 13.2% (West Virginia). Based on bias-corrected estimates, 16 states had a prevalence of severe obesity greater than 10%, a level not seen in the BRFSS self-reported estimates.
Having severe obesity puts one at risk for poor health including increased risk of Type 2 diabetes, heart disease, and cancer.
“Although BMI is a screening measure, and having a high BMI is not a clinical diagnosis of obesity or disease status, population data can be used by state public health officials and health care systems to plan and prioritize support,” said senior author Heidi Blanck, branch chief of the CDC’s Division of Nutrition, Physical Activity, and Obesity. “Supports can include improved access to physical activity and healthy food options paired with obesity treatment services such as lifestyle programs, FDA-approved obesity medications, and surgery.”
Ward uses the CDC’s obesity maps in his own work on projects such as CHOICES (Childhood Obesity Intervention Cost-Effectiveness Study)—for which Blanck is a member of the expert advisory committee. His research involves estimating the scale of obesity prevalence in populations and modeling the cost effectiveness of various interventions, and he knows from experience that small changes in individuals’ BMI can make a difference in ensuring accuracy at the population level. “I’m excited to see bias correction being used for data that so many people rely on,” he said.
Map: National Center for Chronic Disease Prevention and Health Promotion
