November 10, 2022 – In health, place matters. That’s why Harvard T.H. Chan School of Public Health’s Nancy Krieger and colleagues have updated and broadened a project aimed at training people in how to track and monitor socially related disparities having to do with where a person lives.
Over the summer, Krieger, professor of social epidemiology, spearheaded an effort called the Public Health Disparities Geocoding Project 2.0 that offered virtual training to 150 health professionals and academics in how to effectively use area-based social metrics (ABSMs) to monitor and analyze population health and health inequities. Geocoding creates numerical codes for particular areas to highlight how the social features of these areas, including socioeconomic resources and racialized segregation, singly and combined, may be linked with health disparities. Based on the updated training, Krieger and colleagues released an online interactive training manual in late October, free for all.
Researchers have known for decades that a person’s socioeconomic resources, including where they live, along with exposure to residential and occupational segregation, significantly impacts their risk for a whole host of medical conditions, including heart disease, diabetes, HIV, and cancer, said Krieger. “There are many ways that socioeconomic conditions and segregation affect health,” she said. “People with fewer resources could lack income to access nutritious healthy food, work in unsafe jobs, or live in neighborhoods with poor air quality.”
Public health officials, however, often lack the ability to track and monitor these sorts of disparities. Individual-level administrative or medical health records often include data on race and gender, but not socioeconomic data such as income or occupation. “What they do almost inevitably have, however, is an address,” said Krieger, who has worked since her graduate student days in the 1980s to figure out how to use that geographic data to help community members and public health workers identify and reduce inequities among those most at risk for adverse health exposures and outcomes.
Krieger launched the first Public Health Disparities Geocoding Project in the late 1990s. Using administrative records from the Massachusetts and Rhode Island health departments, she and colleagues determined that the geographical level most likely to produce the best data to measure health outcomes was the census tract, and the most robust ABSM was percentage of people below poverty. “No one had ever done this before,” said Pamela Waterman, project director for both the original and latest geocoding project. Waterman recalled that, for many researchers involved in early work on the project, geocoding meant physically finding paper census maps and coding data by hand.
In 2004, the project released a manual on its geocoding methodology and conducted a training on how to use it effectively and avoid common pitfalls. Over the years, said Krieger, the manual and the team’s peer-reviewed publications have been heavily cited and the techniques have been used by thousands of researchers and by health departments around the world.
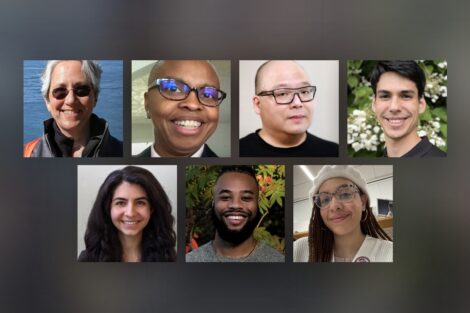
In recent years, more advanced methods have been developed to track racialized economic segregation. Krieger had already been planning to update the training to incorporate those methods when the pandemic began. COVID-19 hit African American and Hispanic communities hard, adding urgency to the effort. Christian Testa, a statistical analyst who joined the project in early 2020, noted, “We have the statistical know-how to be able to document these disparities and explain why they exist. We wanted to be able to share that.” Testa worked on the update alongside Krieger; her longstanding collaborators Waterman and Jarvis Chen, lecturer on social and behavioral sciences; Dena Javadi and Justin Morgan, doctoral students in the Department of Social and Behavioral Sciences; and Enjoli Hall, a doctoral student in MIT’s program on urban planning.
For the summer 2022 training, Waterman coordinated the selection of 150 participants out of more than 500 applicants, including students, academic researchers, health officials, and nonprofit community-based organizations, working on issues such as HIV, tuberculosis, diabetes, and emergency planning. “We wanted to identify people for whom we thought the training would go beyond them, who would bring it back to their student or work cohort,” Waterman said.
The team held two four-day training sessions—one in June and one in July—that included lectures by Krieger, Chen, Testa, and the doctoral students, as well as five case studies, covering topics such as breast cancer mortality in Massachusetts, COVID-19 mortality in Chicago, and health insurance rates across the United States. The training not only included exercises on how to analyze the data, but also on how to best visualize it and communicate it to different audiences, whether on social media or to policymakers or communities. “We wanted to allow participants to get their hands dirty with specific data sets, learning how to handle their idiosyncrasies,” said Testa.
The team members used insights from the June training to inform July training, and then insights from the latter in updating the online training manual, so that it would work both as a refresher for those who took the training as well as a stand-alone course for those coming to it fresh. In addition, online materials include recordings of the lectures and datasets from the case studies so that people can work with them at home.
Project members hope that scores of researchers, health agencies, community-based groups, and advocates will use the project’s geographically based techniques to advance health equity across the U.S.
“A core function of public health is to monitor inequities and see if they are getting worse, staying stagnant, or getting better,” said Krieger. “If you don’t have the metrics to do that easily, you can’t see it.” She added, “It was just incredibly happy-making to see the range of people who were in these trainings and will carry them out into the world.”
