Christian C. Testa, Statistical Data Analyst in the Department of Social and Behavioral Sciences, and others have authored “Visualizing the lagged connection between COVID-19 cases and deaths in the United States“, the newest publication in the HCPDS Working Paper Series.
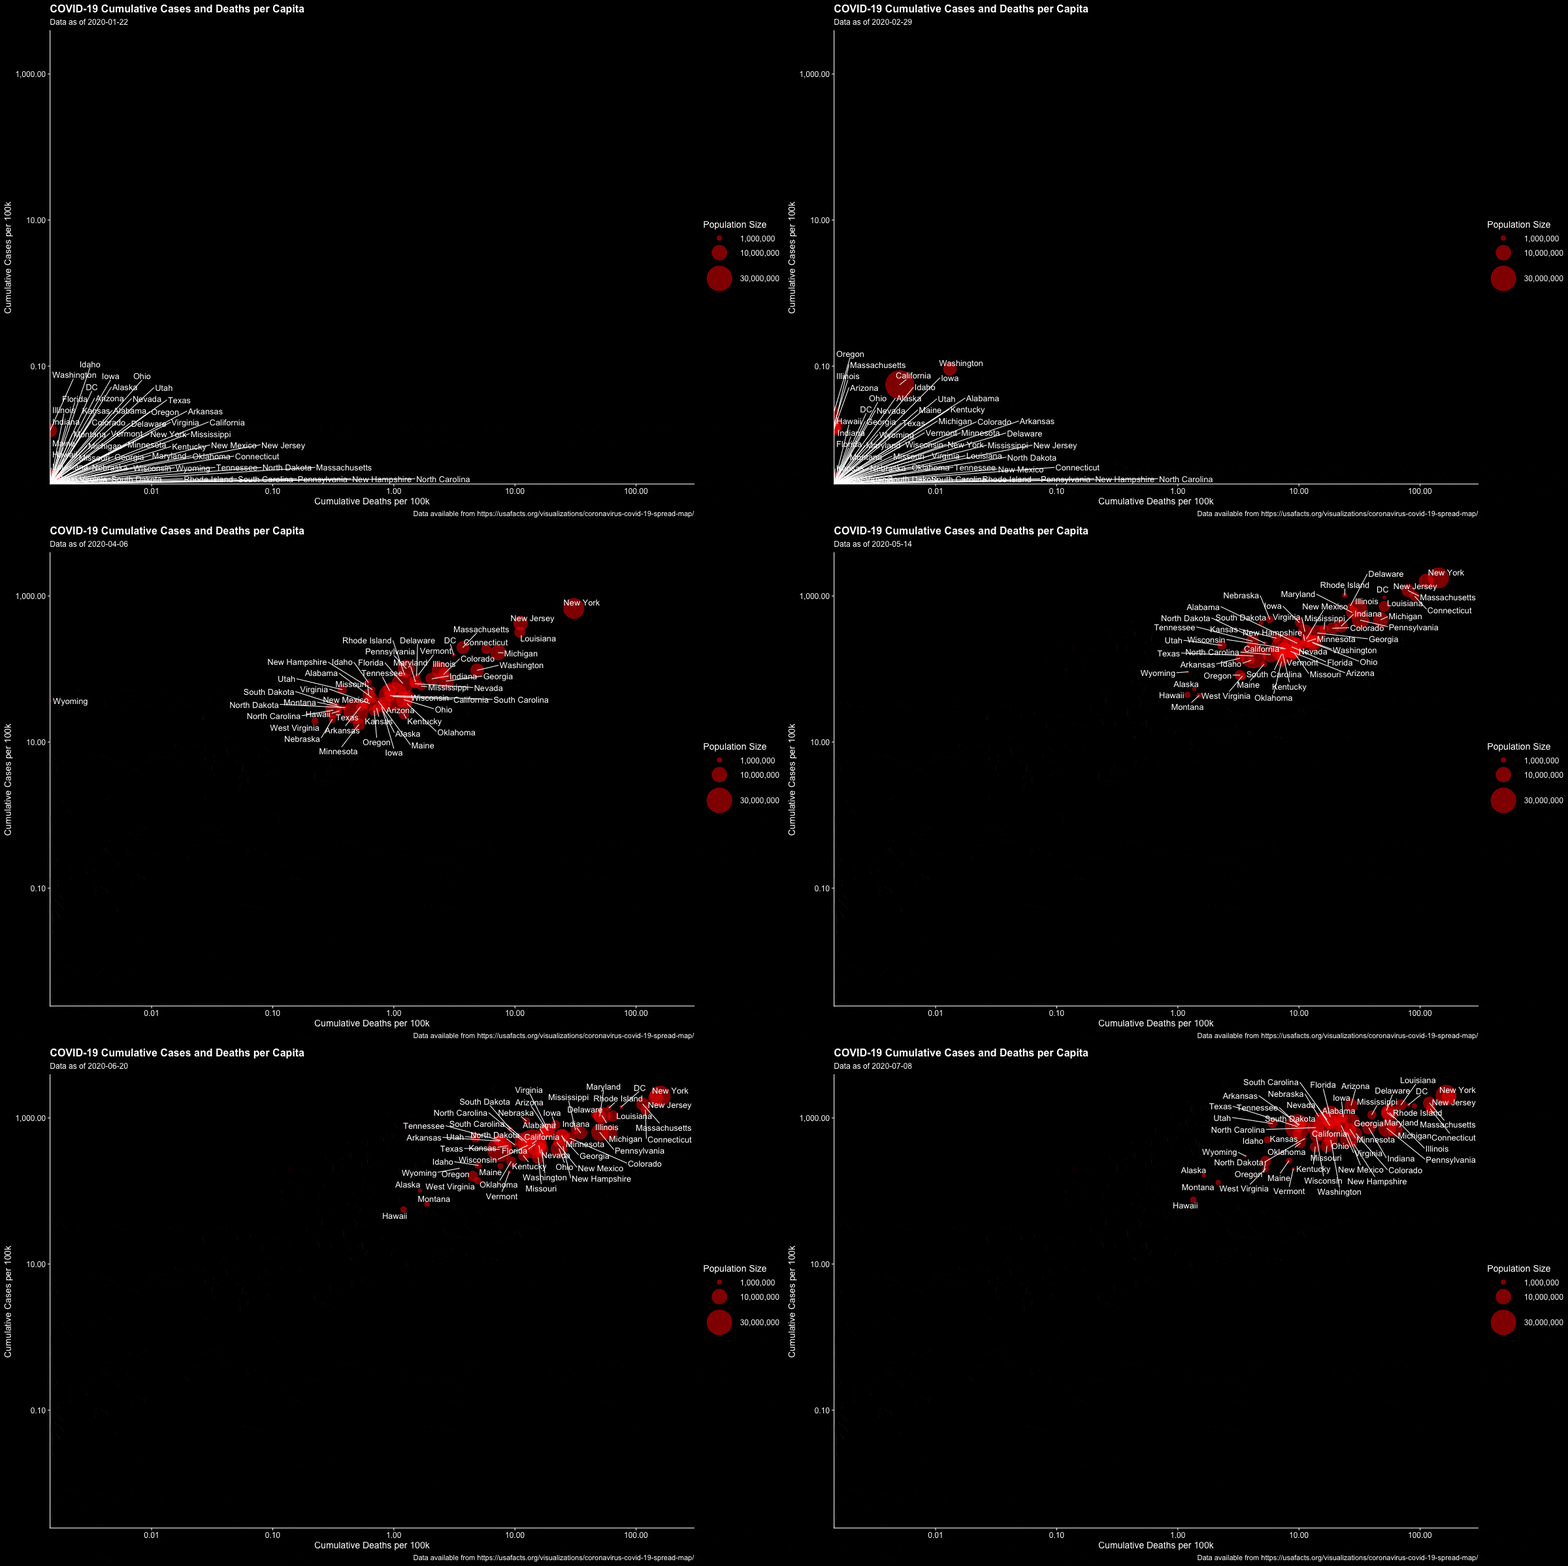
Noted in the paper, Testa has created a data visualization animation that presents the cumulative COVID-19 cases and deaths rates in each U.S. state over time. The animation, in particular, shows death occurring 2-8 weeks after the start of COVID-19 cases.
SBS-affiliated co-authors include Drs. Nancy Krieger, Professor of Social Epidemiology, and Jarvis Chen, Research Scientist in the Department of Social and Behavioral Sciences.

Abstract
Data visualizations of the COVID-19 pandemic in the United States often have presented case and death rates by state in separate visualizations making it difficult to discern the temporal relationship between these two epidemiological metrics. By combining the COVID-19 case and death rates into a single visualization we have provided an intuitive format for depicting the relationship between cases and deaths. Moreover, by using animation we have made the temporal lag between cases and subsequent deaths more obvious and apparent. This work helps to inform expectations for the trajectory of death rates in the United States given the recent surge in case rates.


